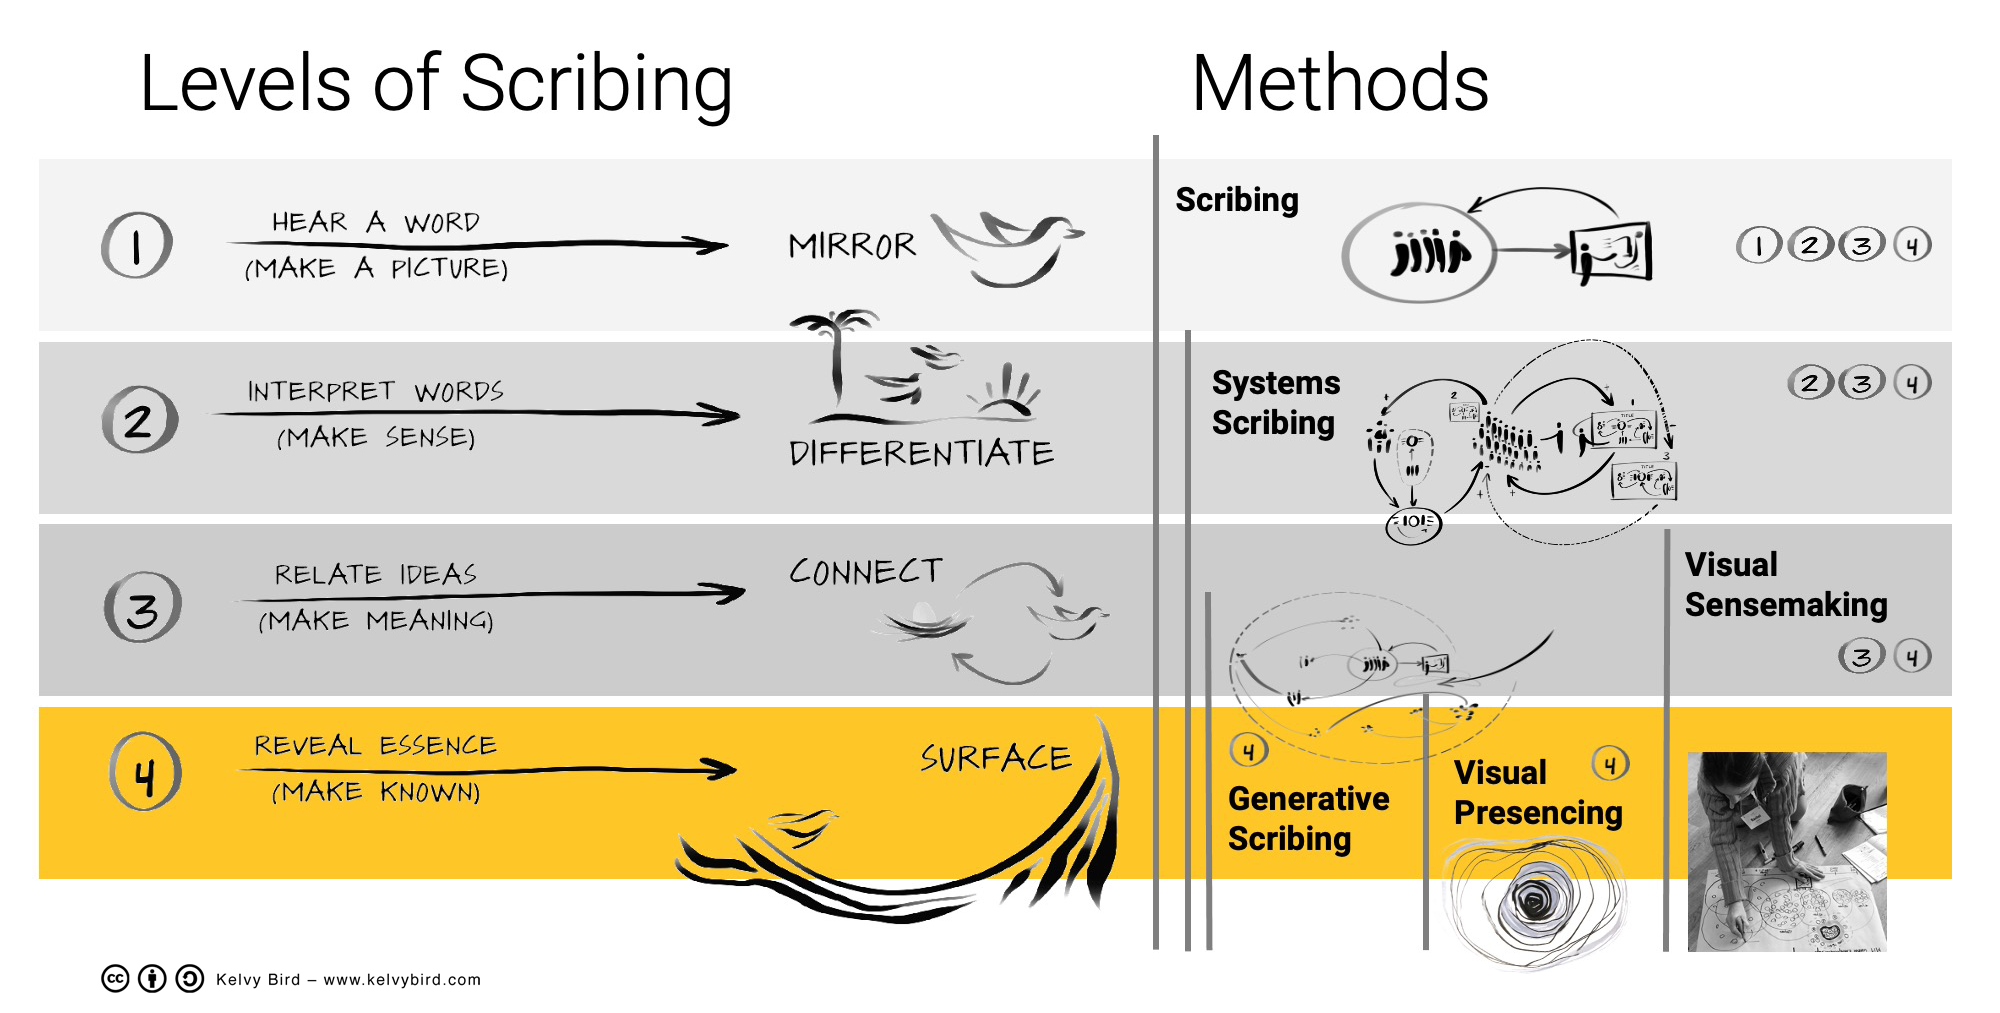
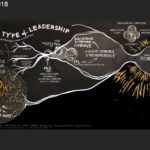
There exist depths, or phases, of scribing that directly correlate with attention. Different “levels” of listening can help us participate in a shift of awareness and possibility. Otto Scharmer has described four levels of listening: (1) downloading; (2) factual; (3) empathic; and (4) generative. I apply each level of listening to the visual practice of scribing, as depicted below, and you can read more on each level here.
Methods of Scribing
Furthermore, there are various methods of scribing that fit within, and support, each level. Among these are:
Scribing
Scribing (also known as graphic recording/facilitation) is a visual practice that has increased in contemporary use since the 1970’s. An artist maps out ideas while people talk, and they can see a picture unfold right in front of their eyes. The drawing establishes connections within content, aids with insight, and supports decision-making. It’s essentially a language that weaves words and pictures to facilitate group learning and cultural memory, and is now embraced around the world as a popular social art and meeting tool.
Systems Scribing
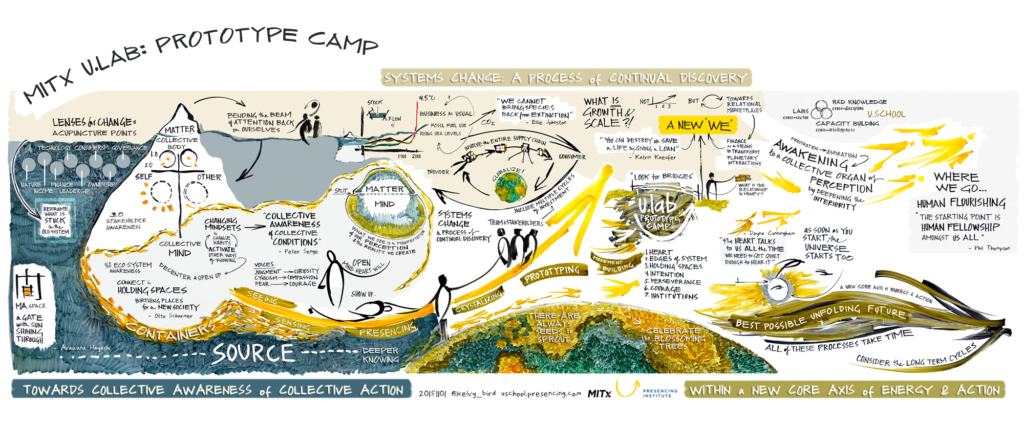
Systems Scribing is an experimental visual practice that combines graphic facilitation with the science of systems thinking. Systems scribing can be done in the moment or it can be iterative, providing cycles of feedback while it uncovers dynamics and interdependencies. The method strives to produce visual artifacts that make implicit structures and behaviors explicit, supporting ongoing reflection and thinking over time. (Co-created with Jessica Riehl.)
Generative Scribing
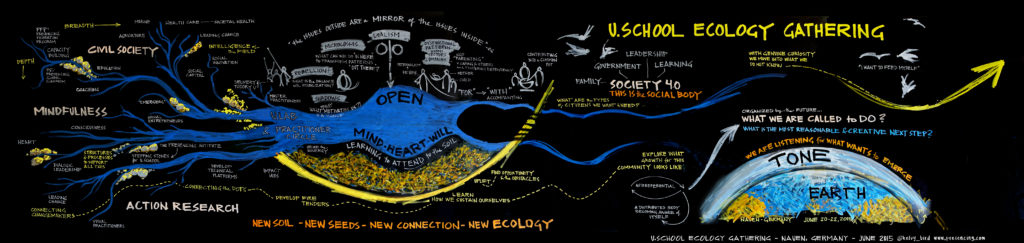
Generative Scribing advances these practices by extending the range of the practitioner to an entire ecosystem, while drawing with an attunement to energy. A generative scribe calls particular attention to an emerging reality that is brought to life by, and for, the social field in which it’s created. Because of its interactive and co-creative nature, it serves as a device for social seeing, while offering a route to a sacred way of being, where the spirit of our humanity prevails over any individual agenda.
Visual Presencing
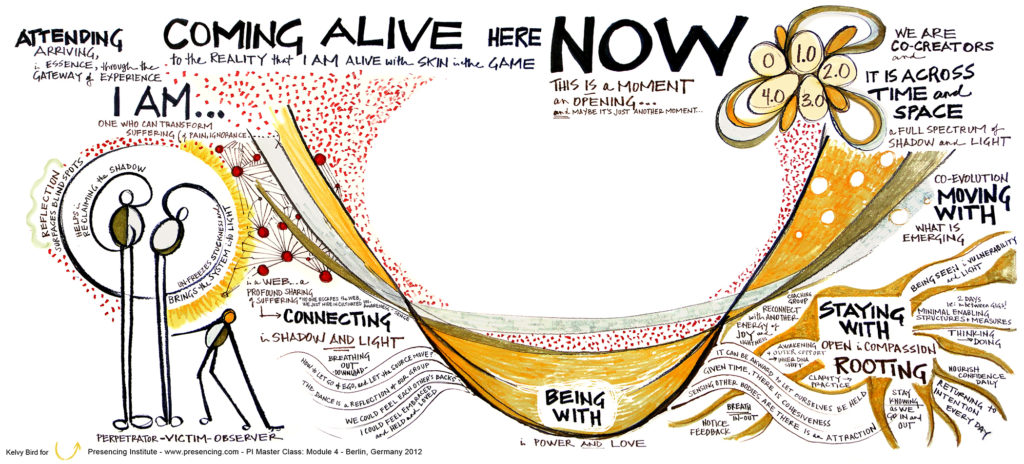
Visual Presencing is the act of two-dimensionally representing an experience of presencing. “Presencing, the blending of sensing and presence, means to connect from the Source of the highest future possibility and to bring it into the now”. (Otto Scharmer) Presencing also means “being with”, in order to access the potential of a moment, to open to a channel of spirit. Visual presencing aids with this attunement, both for the artist during the creative process, and for those engaging with life force through a picture. It can be practiced in private, or embedded as a method within the more social art of scribing.
Visual Sensemaking
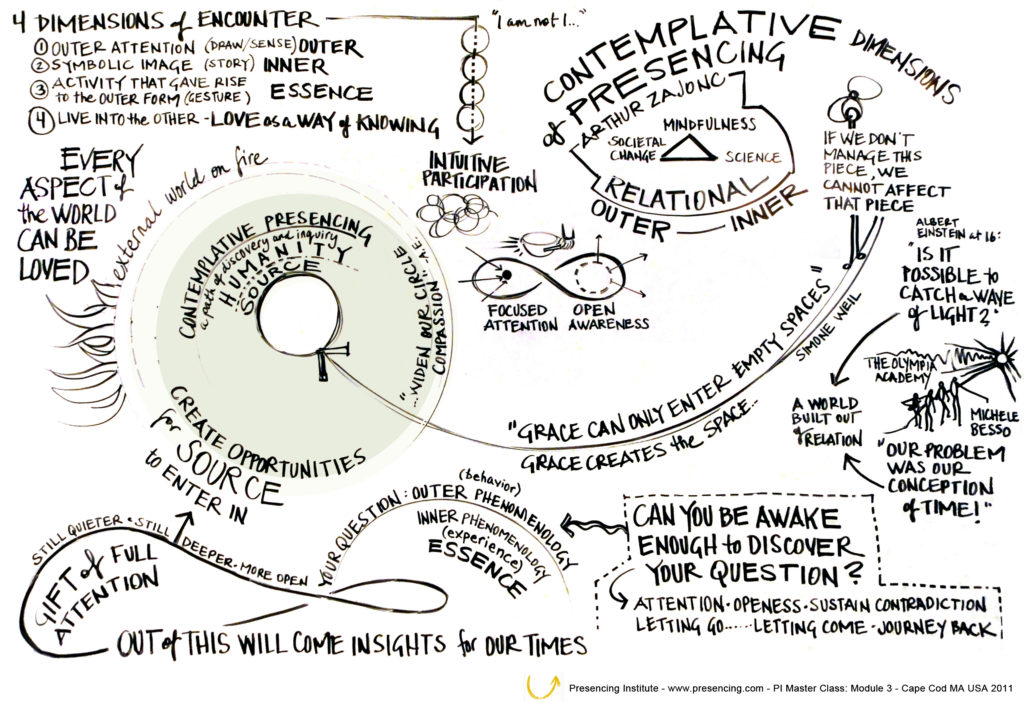
Visual Sensemaking (as we now apply the term) is a method that uses two-dimensional language to “unpack” a current condition, inquire into its complexity, connect with source through presencing, and reveal an emergent, more coherent, possible future.
In Application
All methods are valuable in the right context, and can be combined in application at the same time, in conjunction, to enhance one another. Part of a visual practitioner’s skill is to quickly discern which approach is most useful when, and to be able to shift modalities in an instant.
For example, I might start scribing a session with a mindset that a systems method is most useful. I define parts, relationships, and feedback loops. But after drawing for just 20-minutes, I might realize that the group and system have a container strong enough to allow for deeper meaning to come through the experience, and I will slow down to pay finer attention to the tone and field, while starting to bypass more of the factual data.
It can go in the other direction, too, where I begin with a more generative approach, but realize the content calls for greater definition and clarity. The shift then would be to increase the inclusion of words and details, while suspending my inclination to attend to the energy.
Again, all levels of scribing are useful and necessary! None are better or worse than any other. And to note, there are dozens of other practices that fit within these levels (terms like graphic recording, graphic facilitation, sketch noting, mind mapping, etc….) The main thing to keep in mind is RANGE.
“Sneak Peek” Presentation
From a 30-minute zoom session, hosted on Jan 21, 2022 with Marie-Pascale Gafinen. See more context and examples for each method. (Eight seconds per slide, if not otherwise animated.)
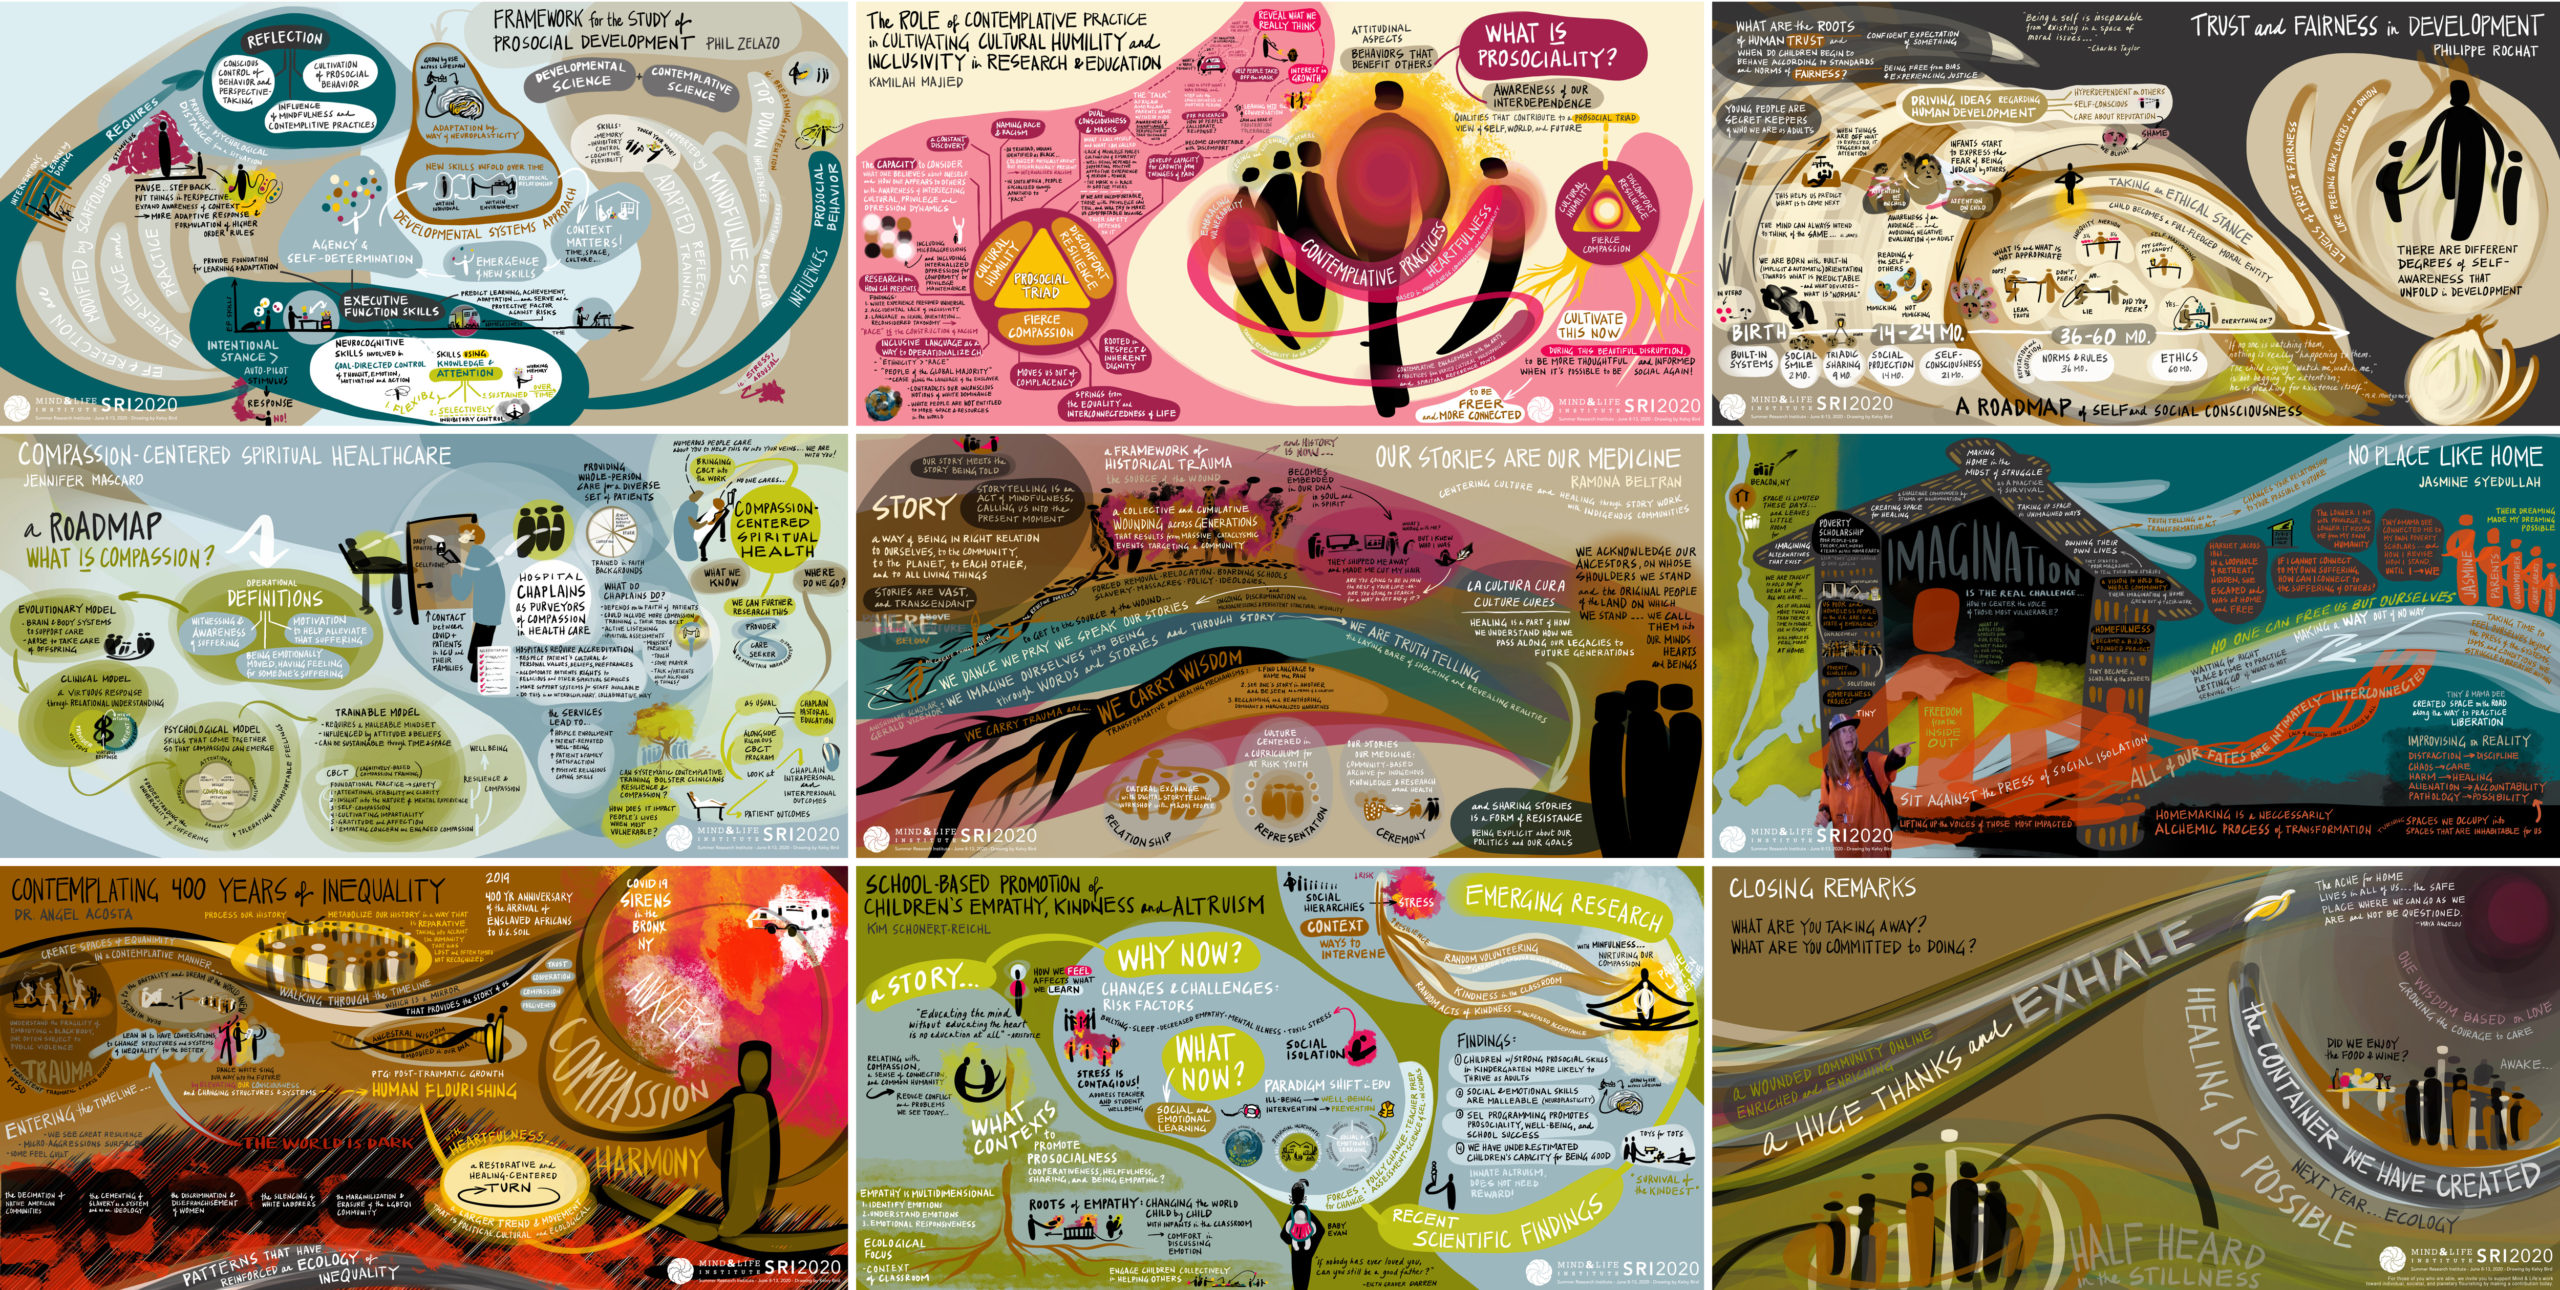
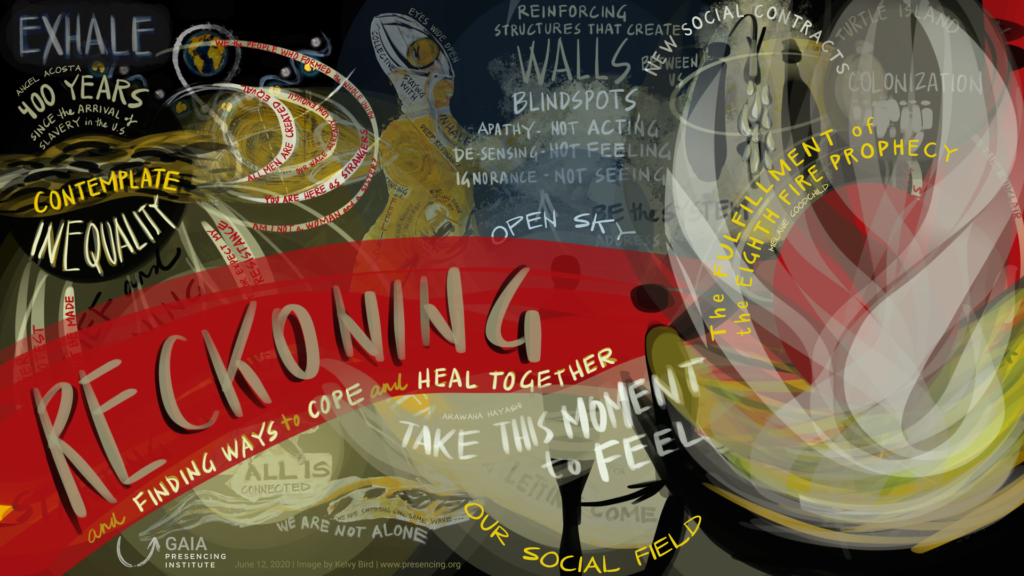
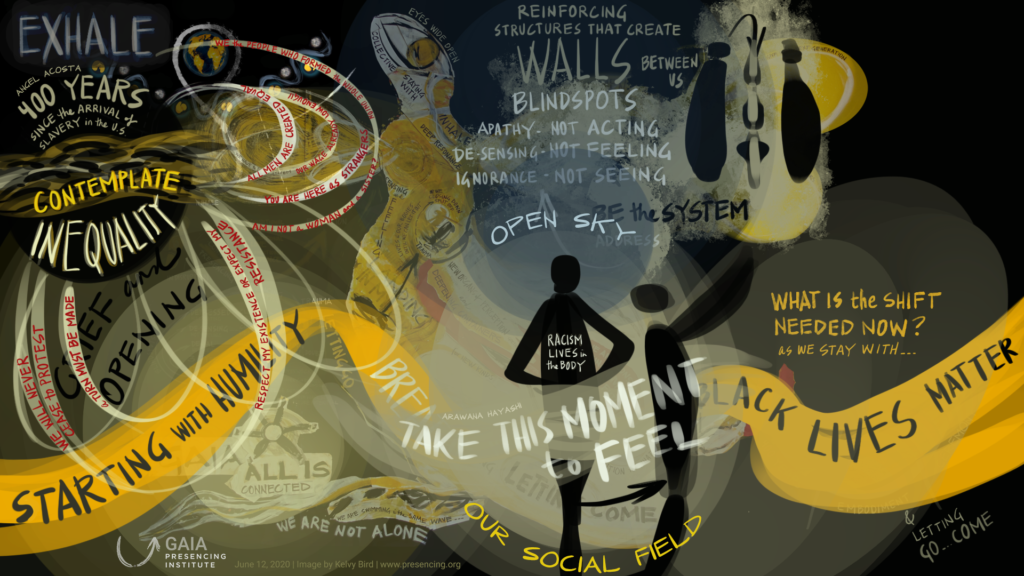
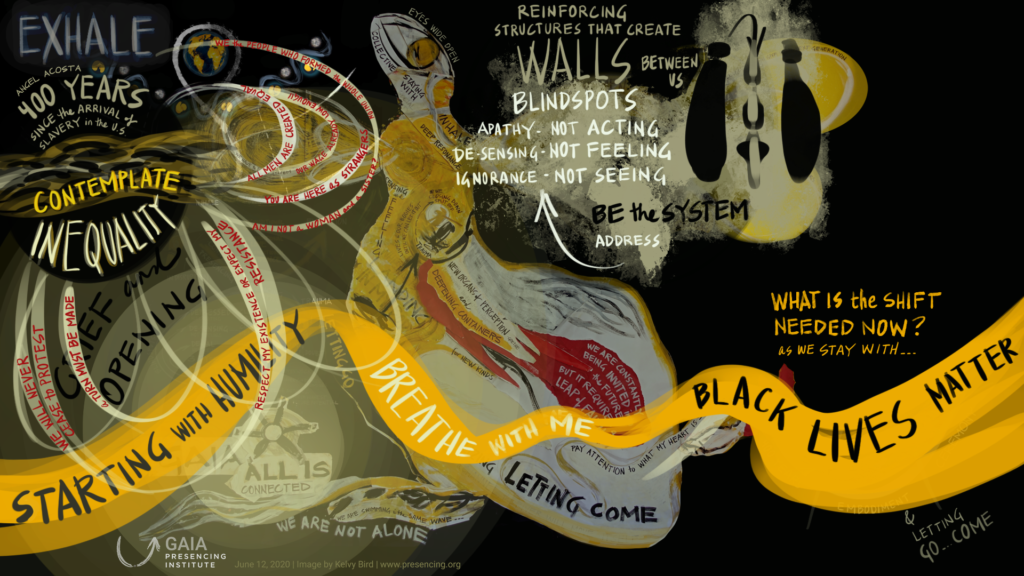
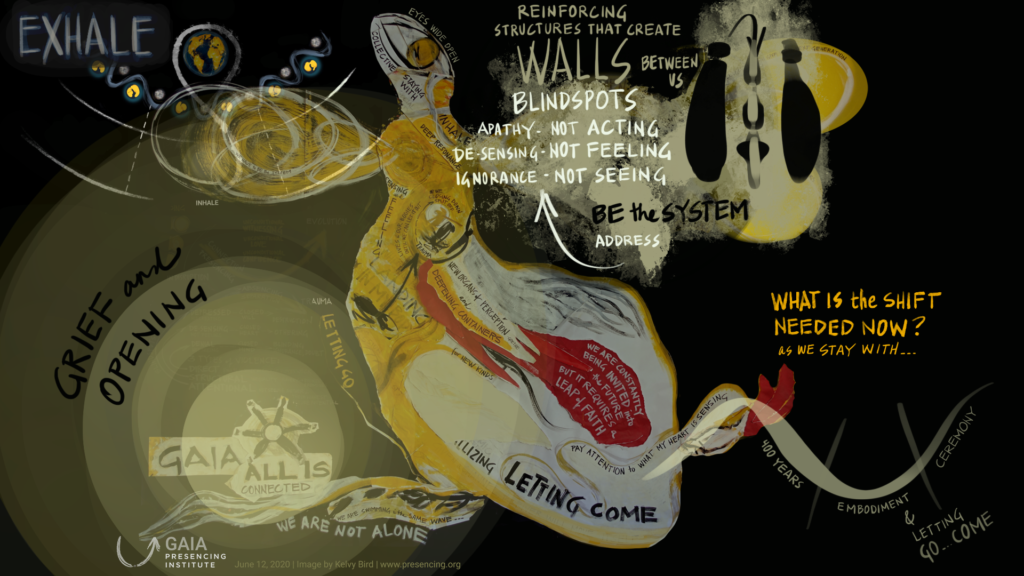
It was a great honor and pleasure to participate in Mind and Life‘s recent Summer Research Institute – as contemplative faculty offering scribing of key faculty talks, and as a member of the community integrating mindfulness into current daily life. The theme of the program was “Cultivating Prosocial Development Across the Lifespan: Contexts, Relationships, and Contemplative Practices”. The sessions offered a particular nest for healing, in a week thick with reckoning after the police murder of George Floyd, and during continual Black Lives Matter protesting and awareness-raising around the world.
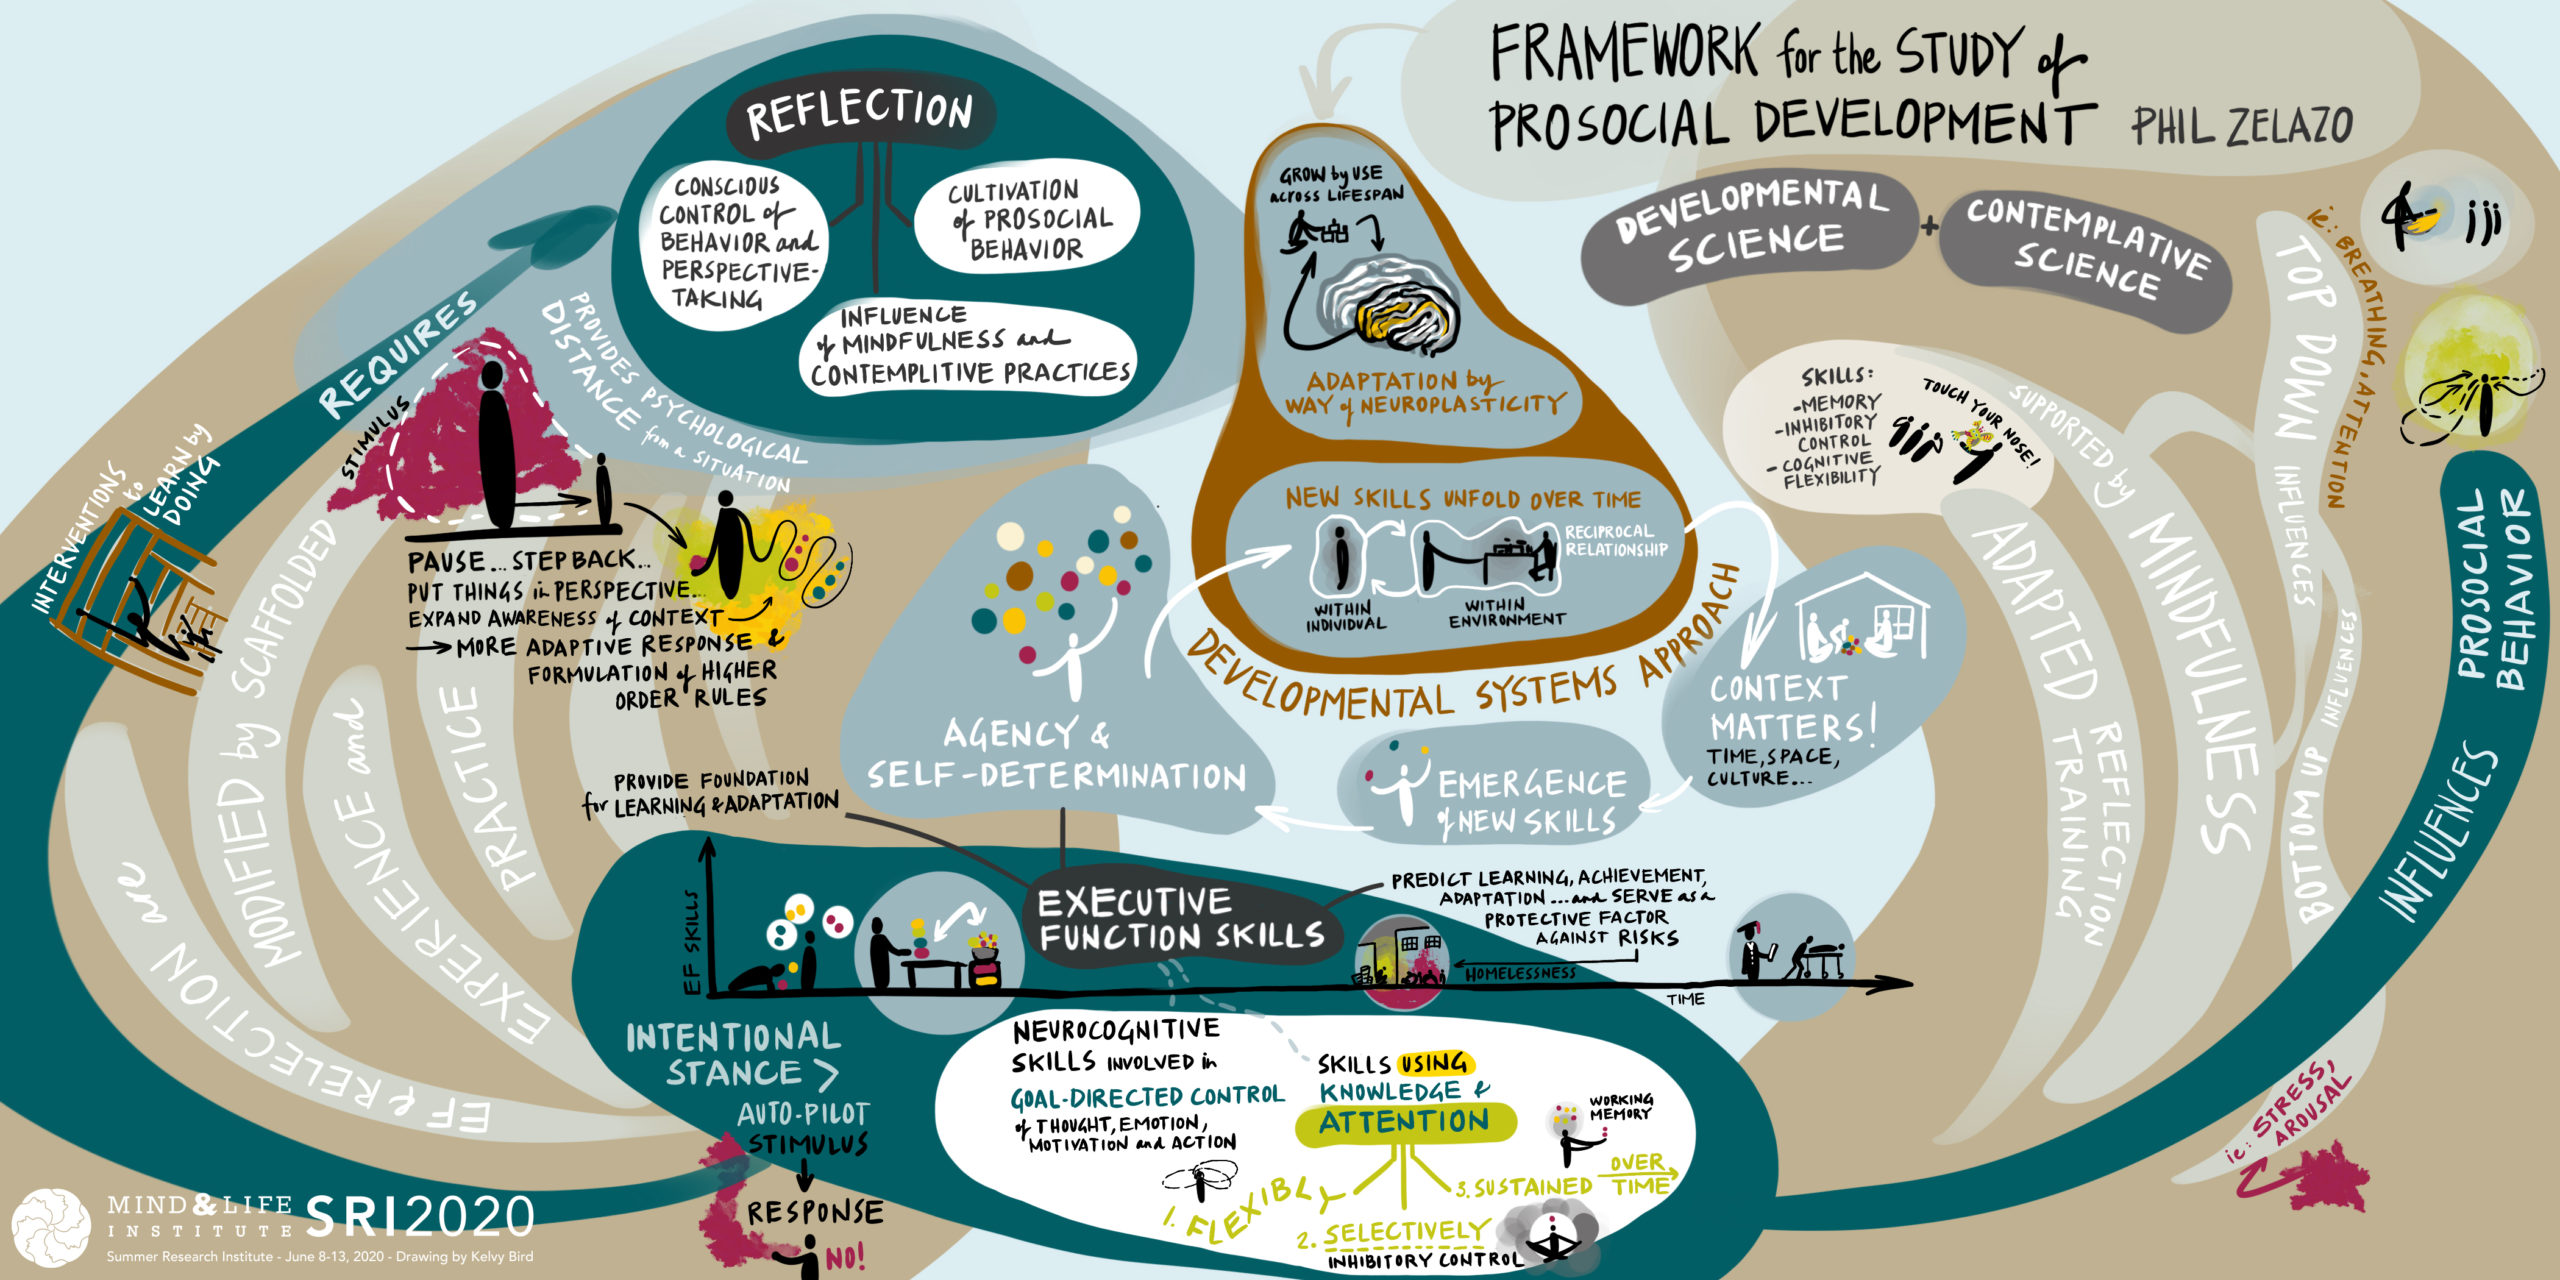
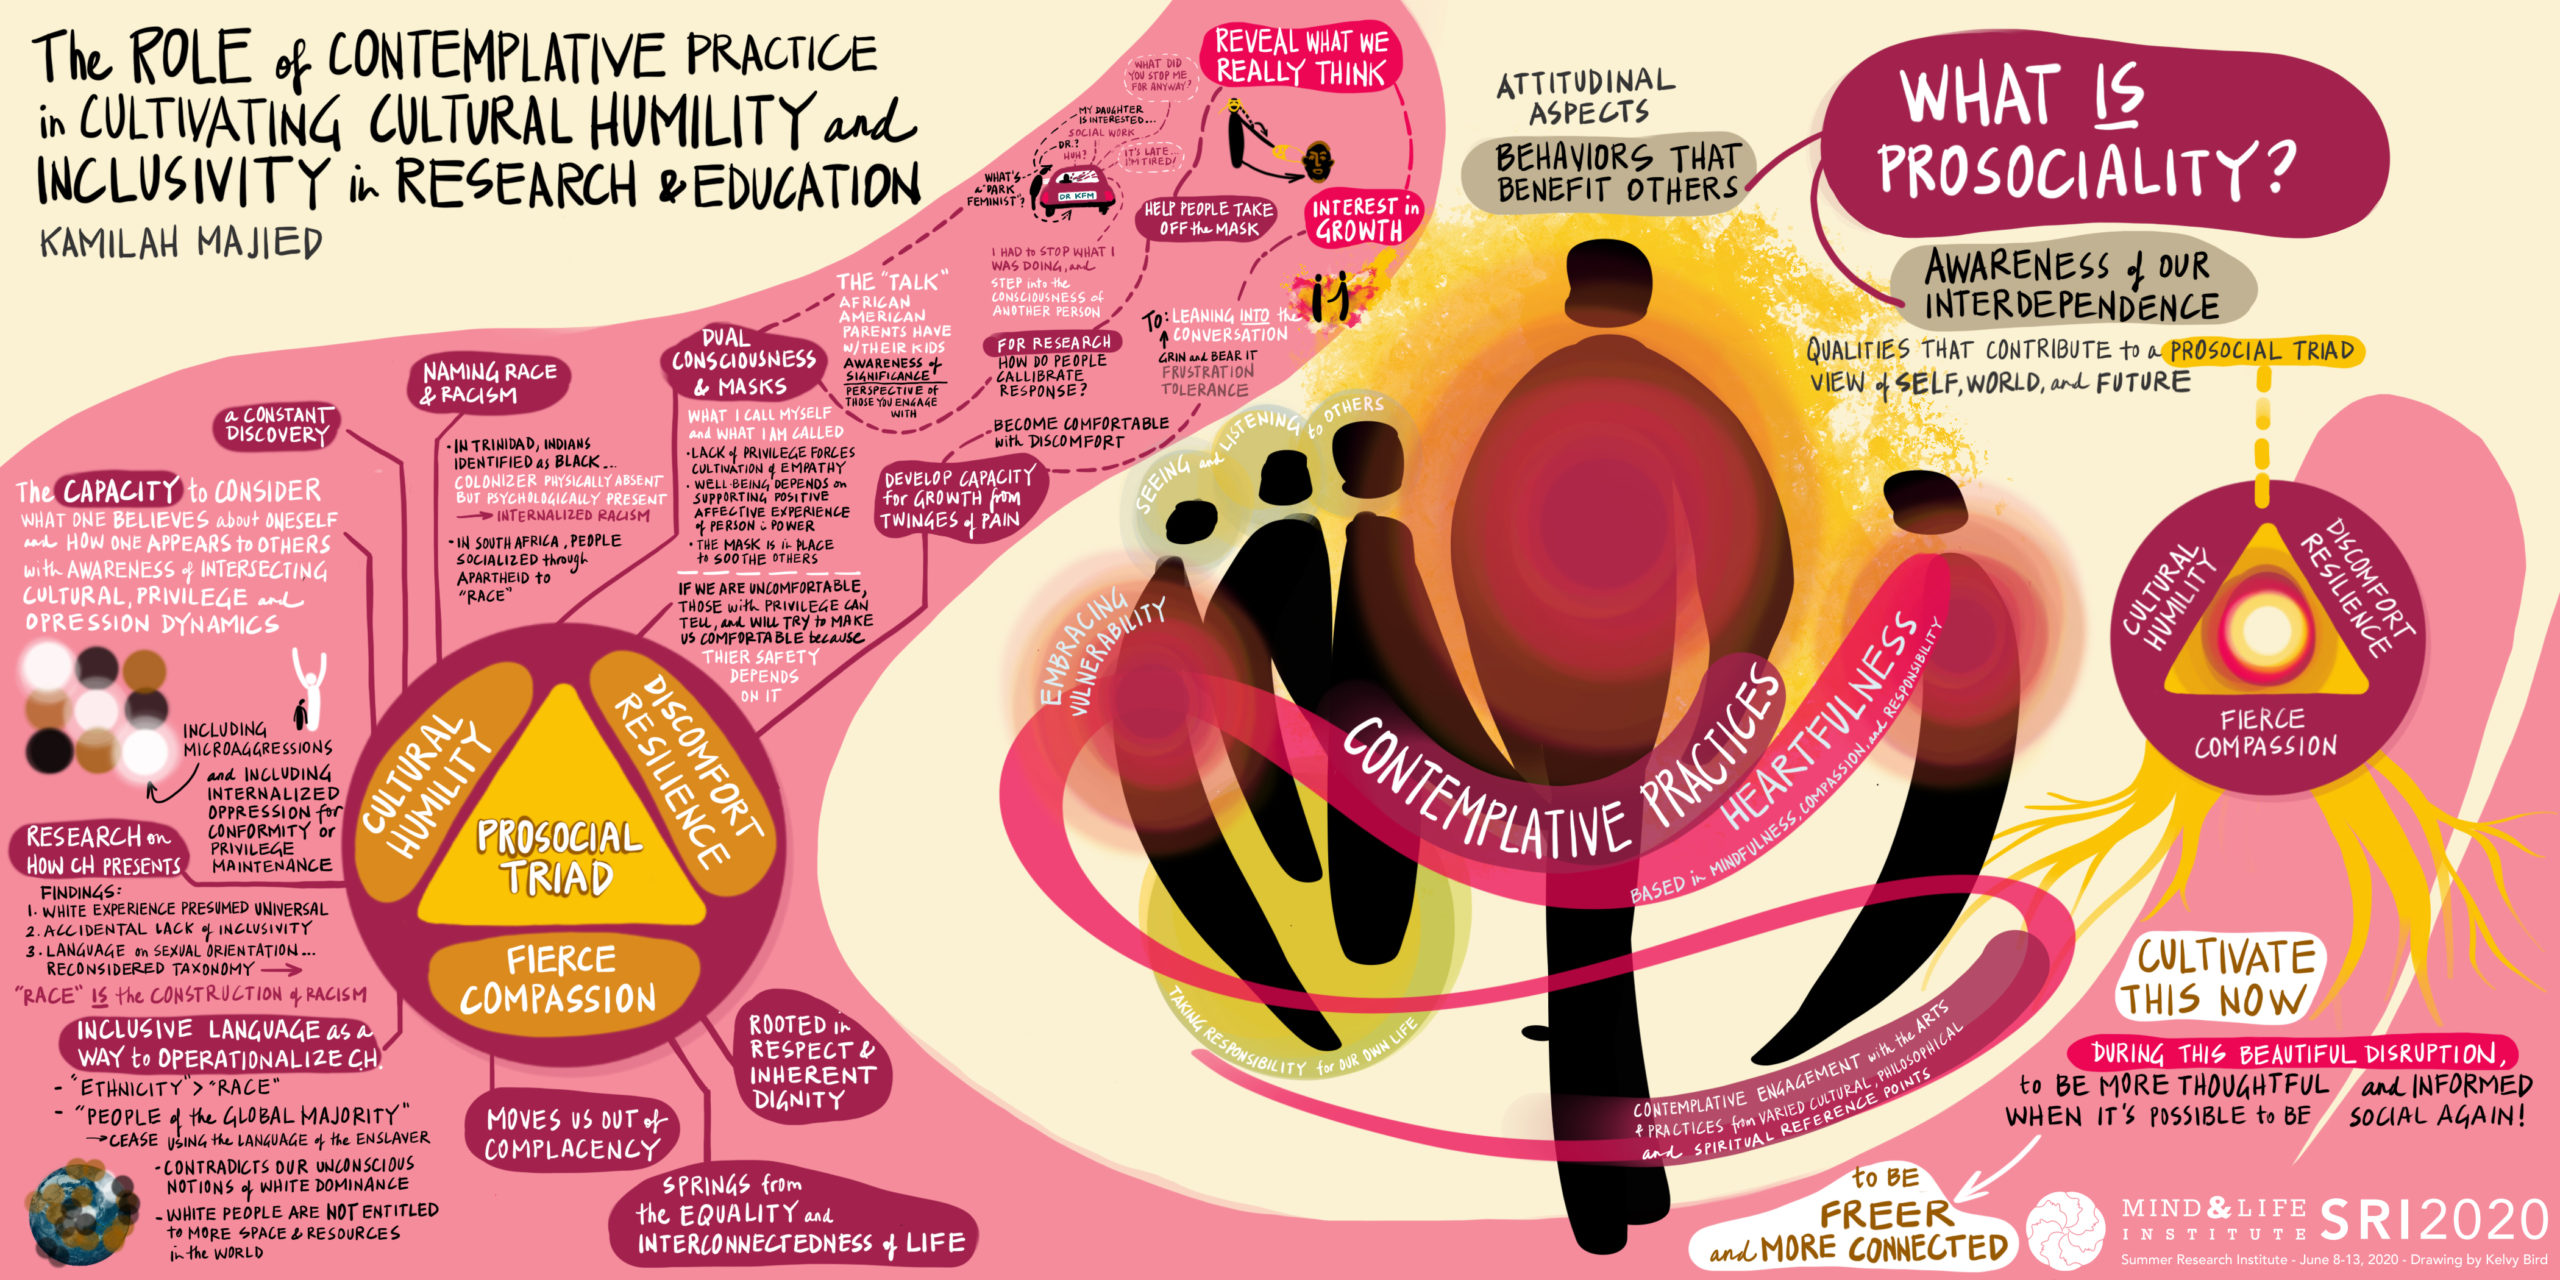
Some process and technical info: I worked on an iPad Pro with the Procreate application, to draw out eight pre-recorded 45-minute talks. Then for the final closing remarks, i scribed using an IPEVO document camera to share the live drawing into the Zoom meeting room. I carefully picked one palette of ~12 elemental colors at the onset; the images below show a range of various combinations. As in life, art.
A deep bow of appreciation to the entire Mind & Life team – Bobbi, Josh, Juan, and Ryan – to all the faculty, and especially to my dear friend Robert Roeser, for including me in this transformative experience and the support along the way.
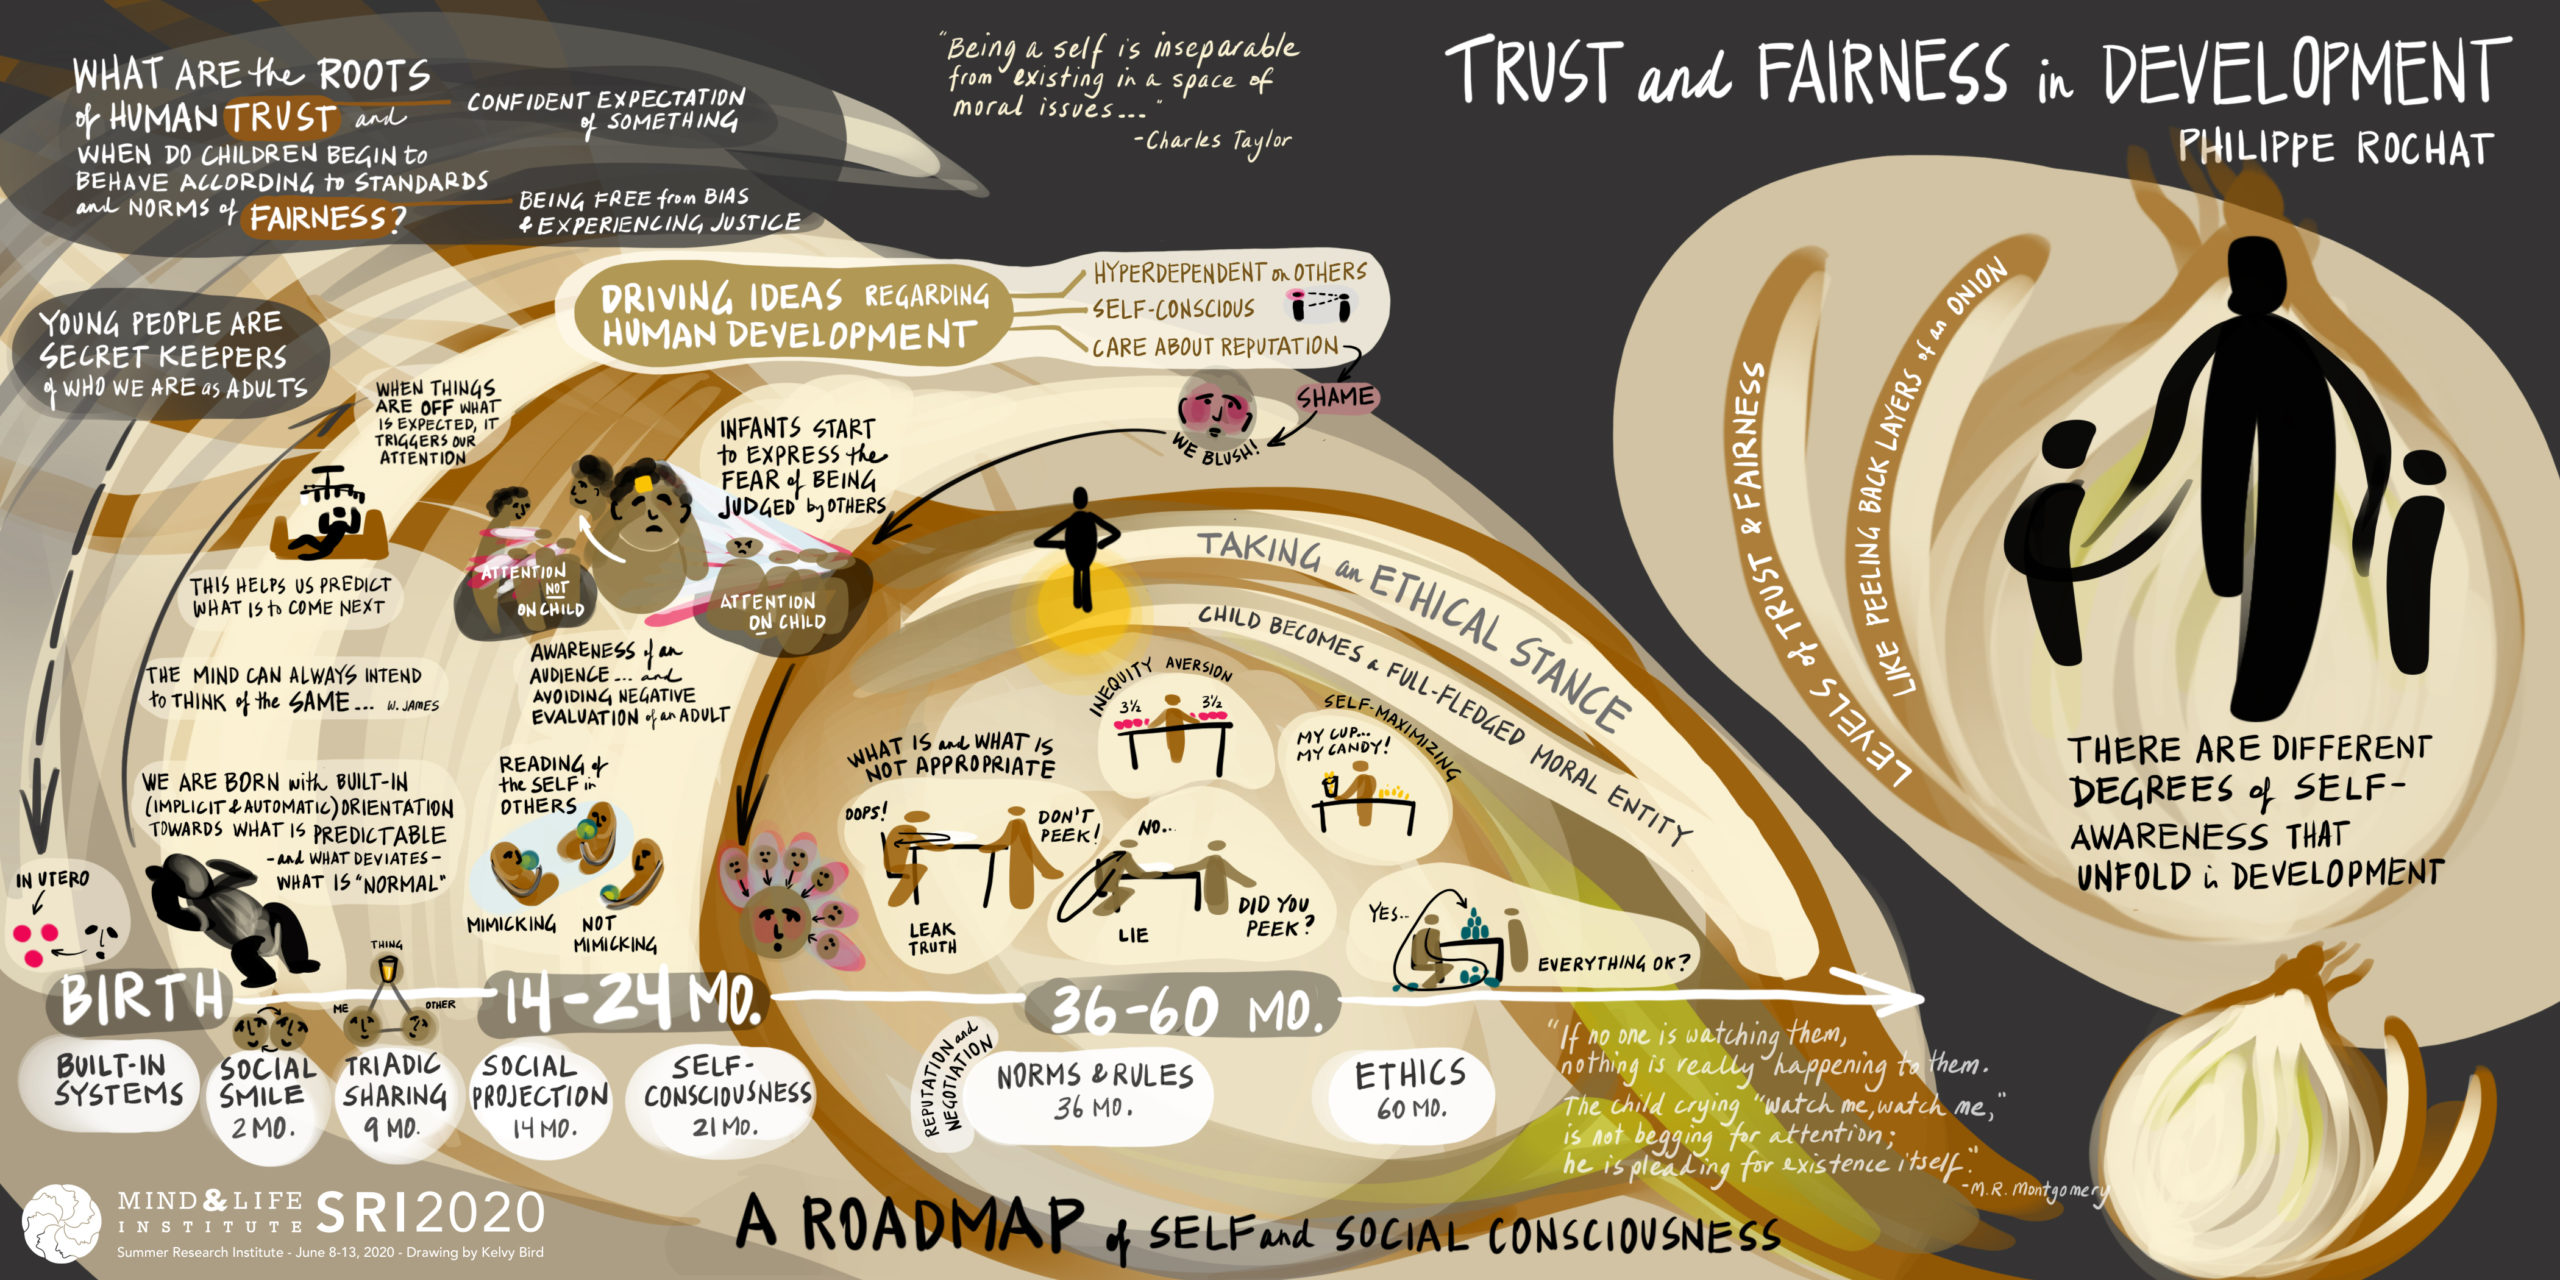
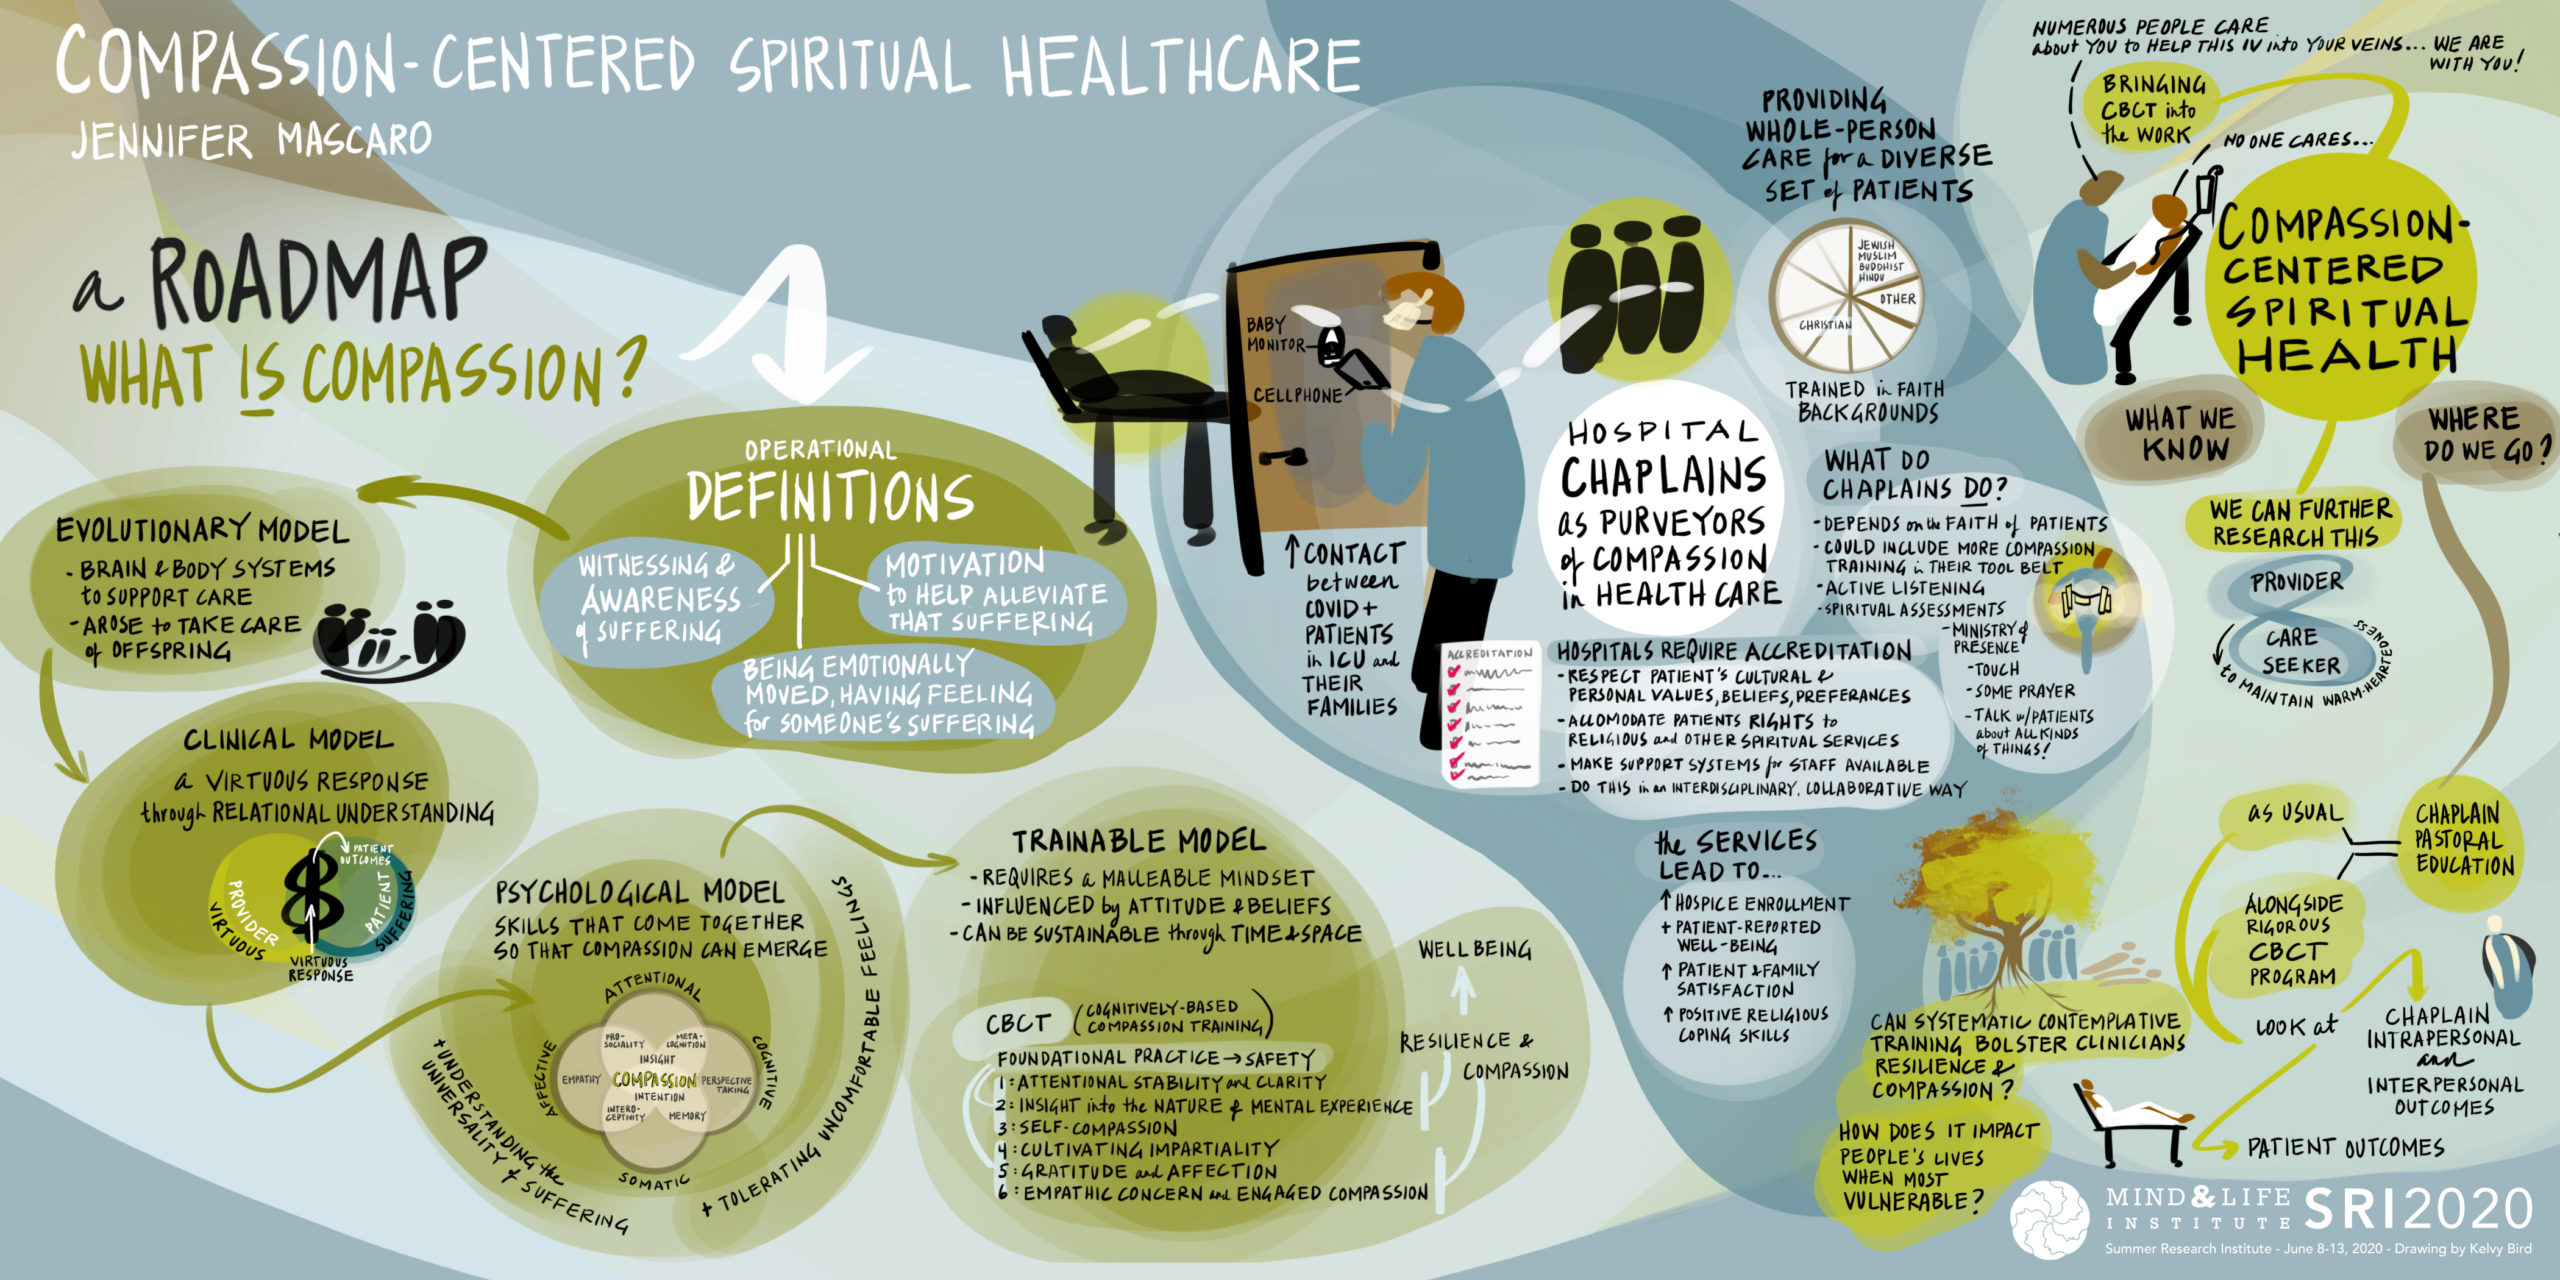
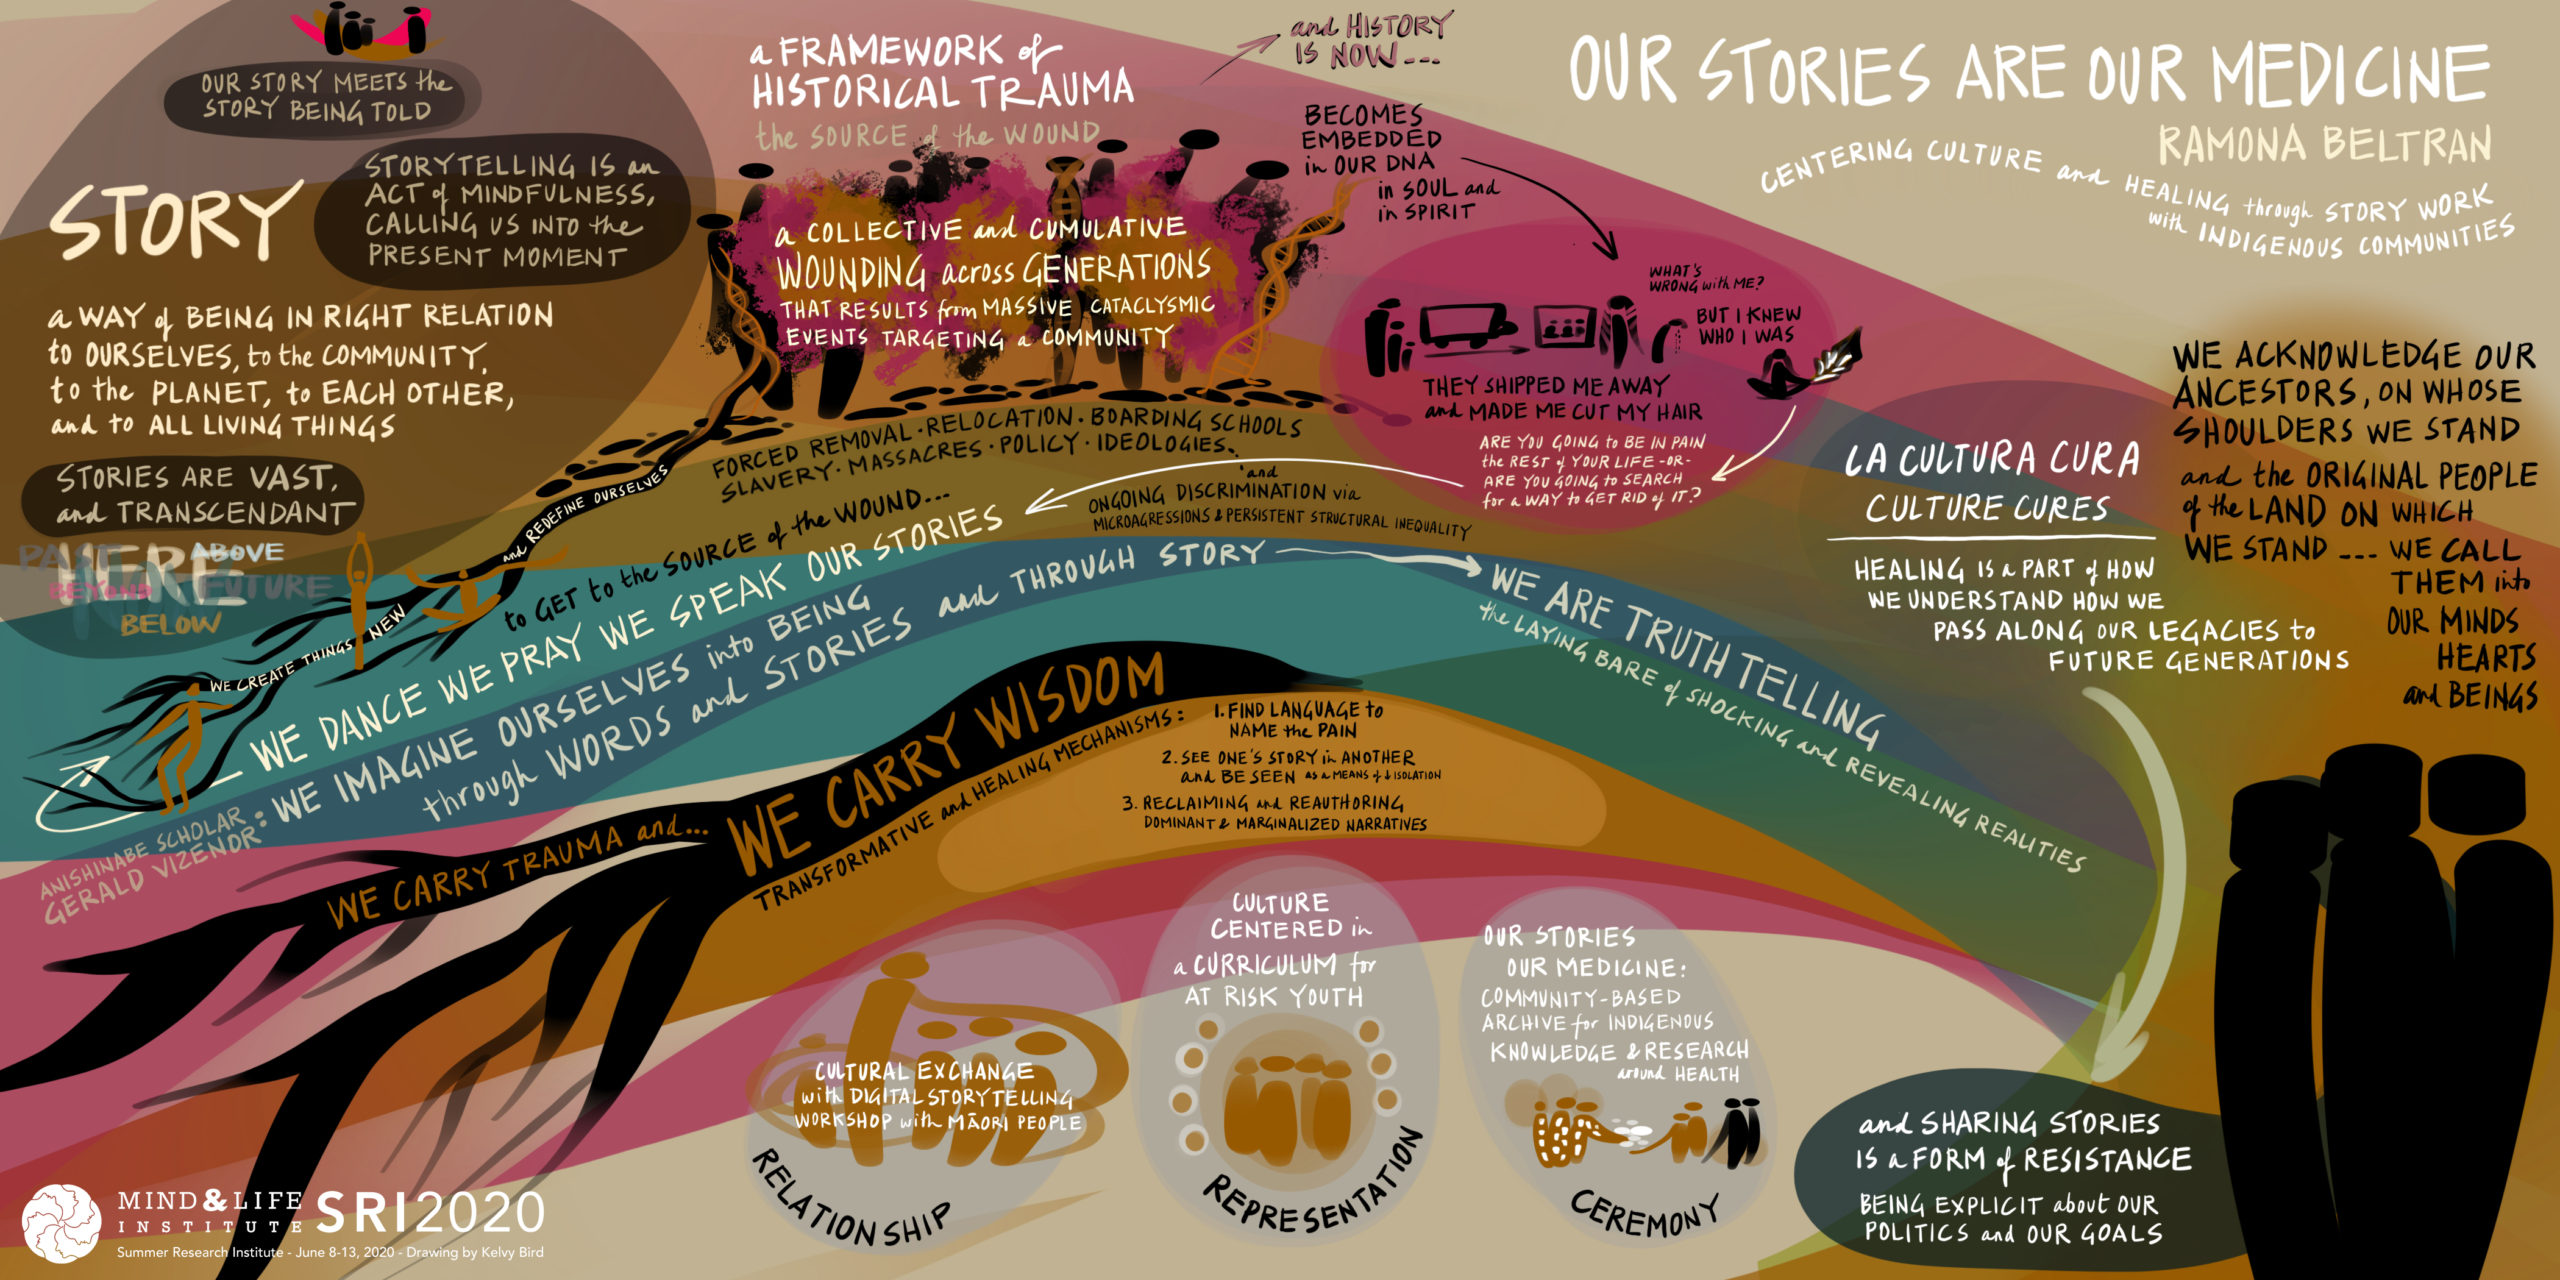
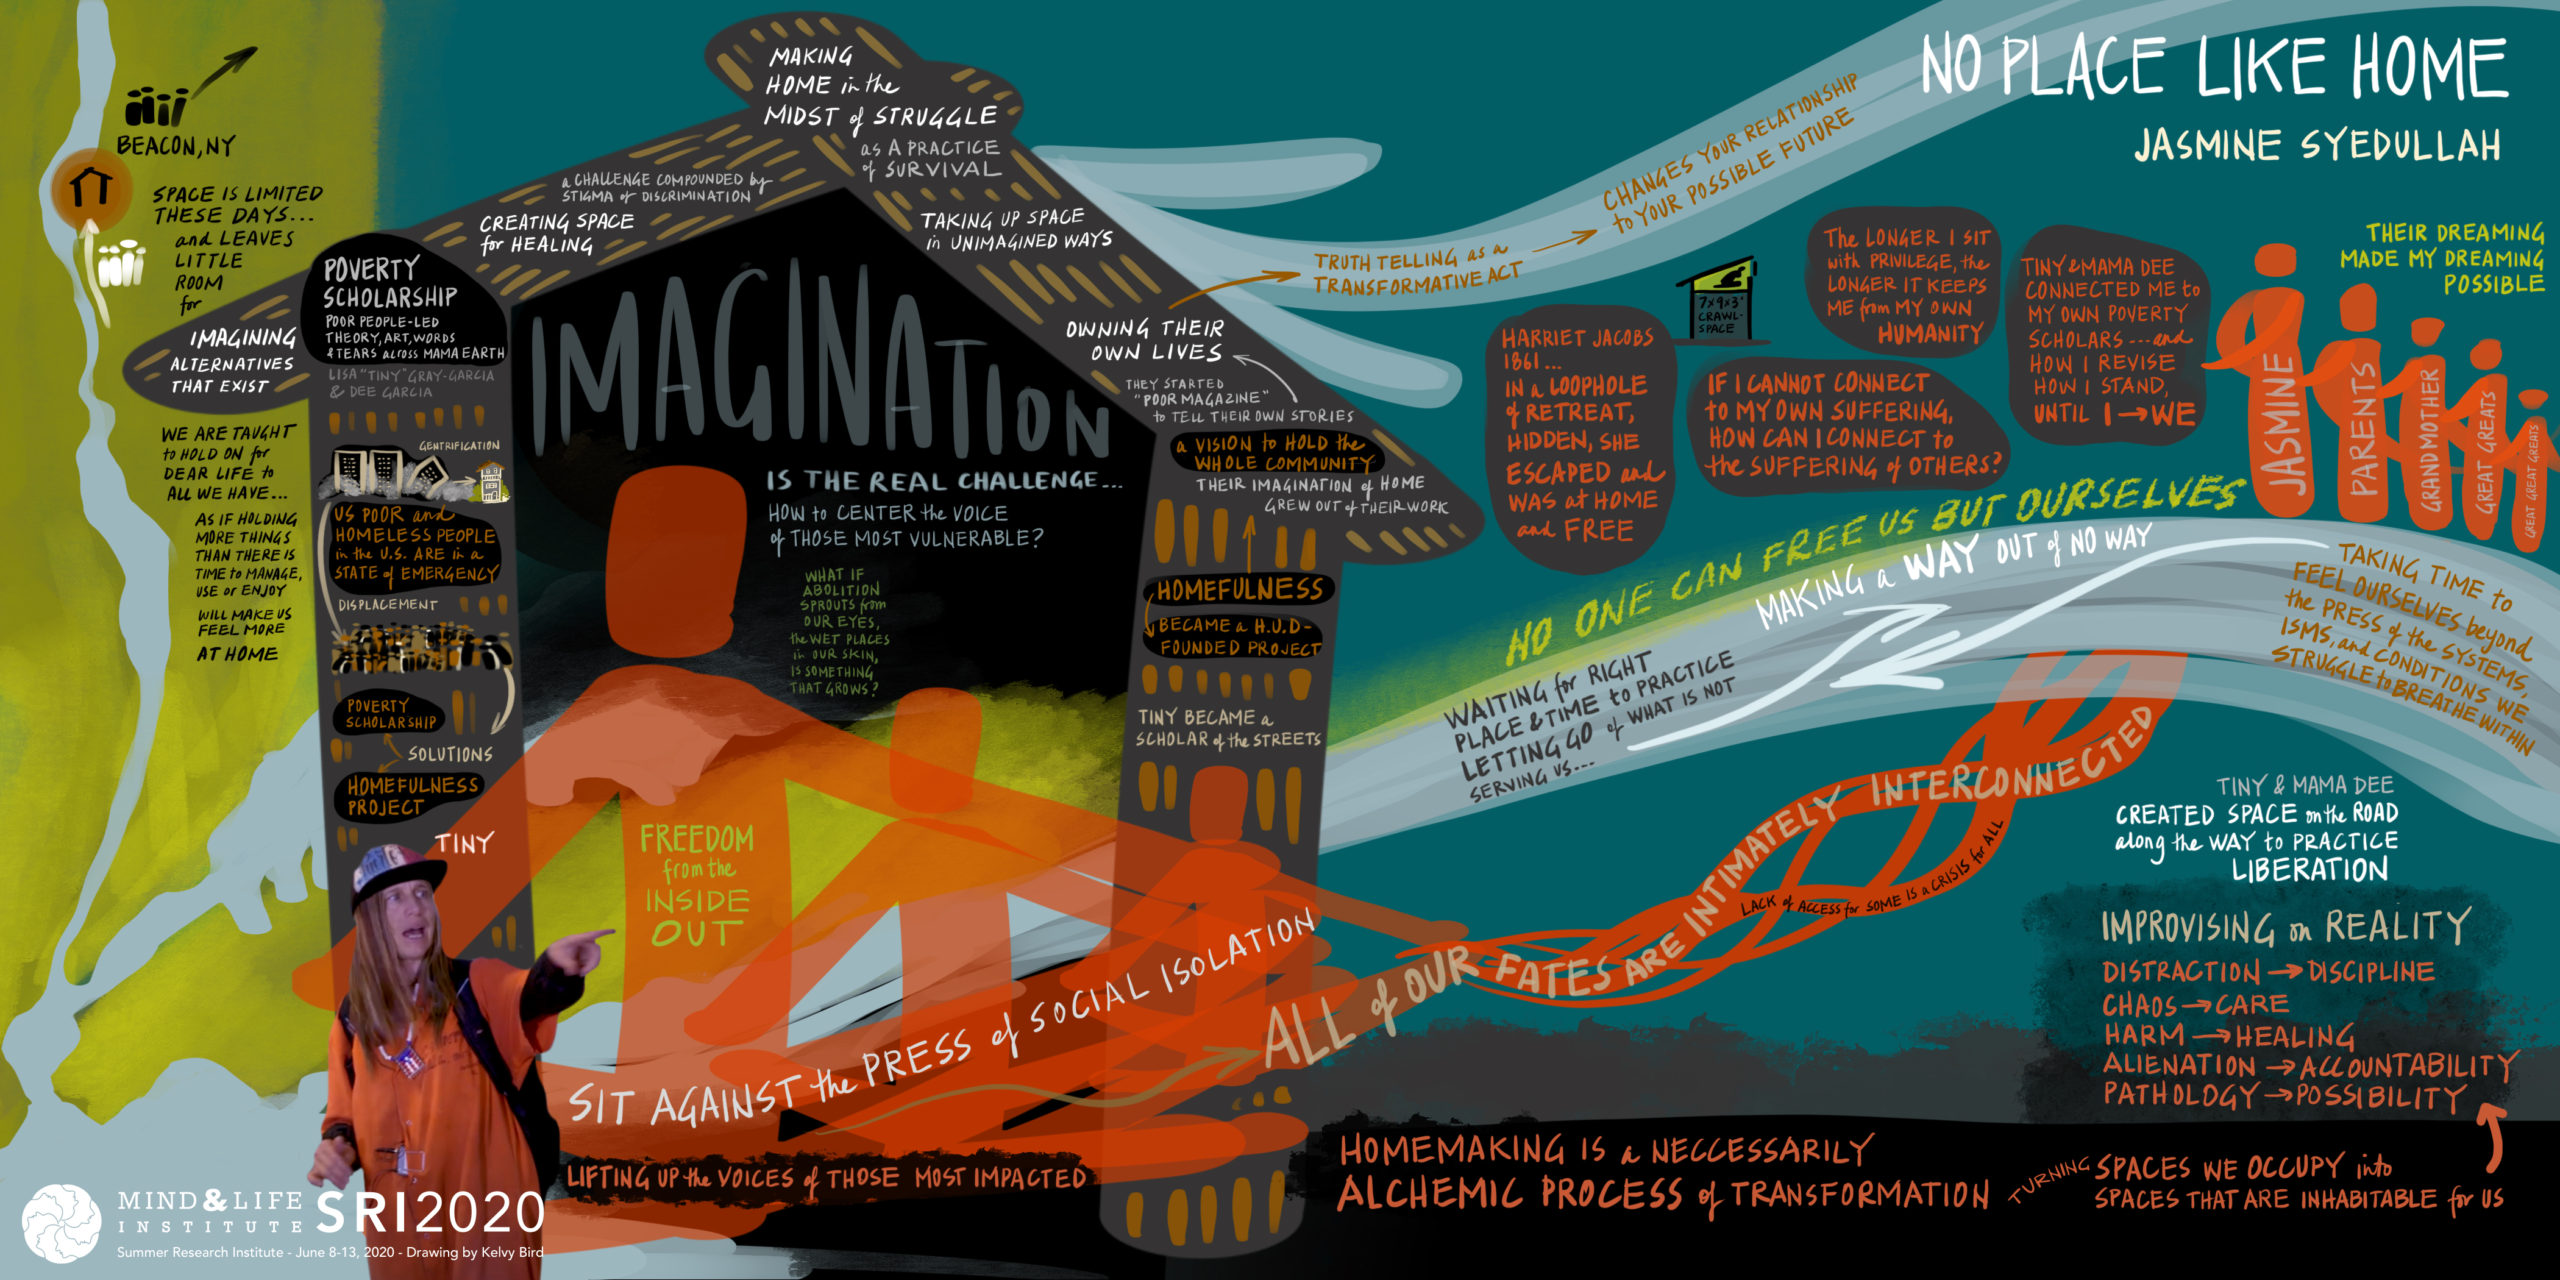
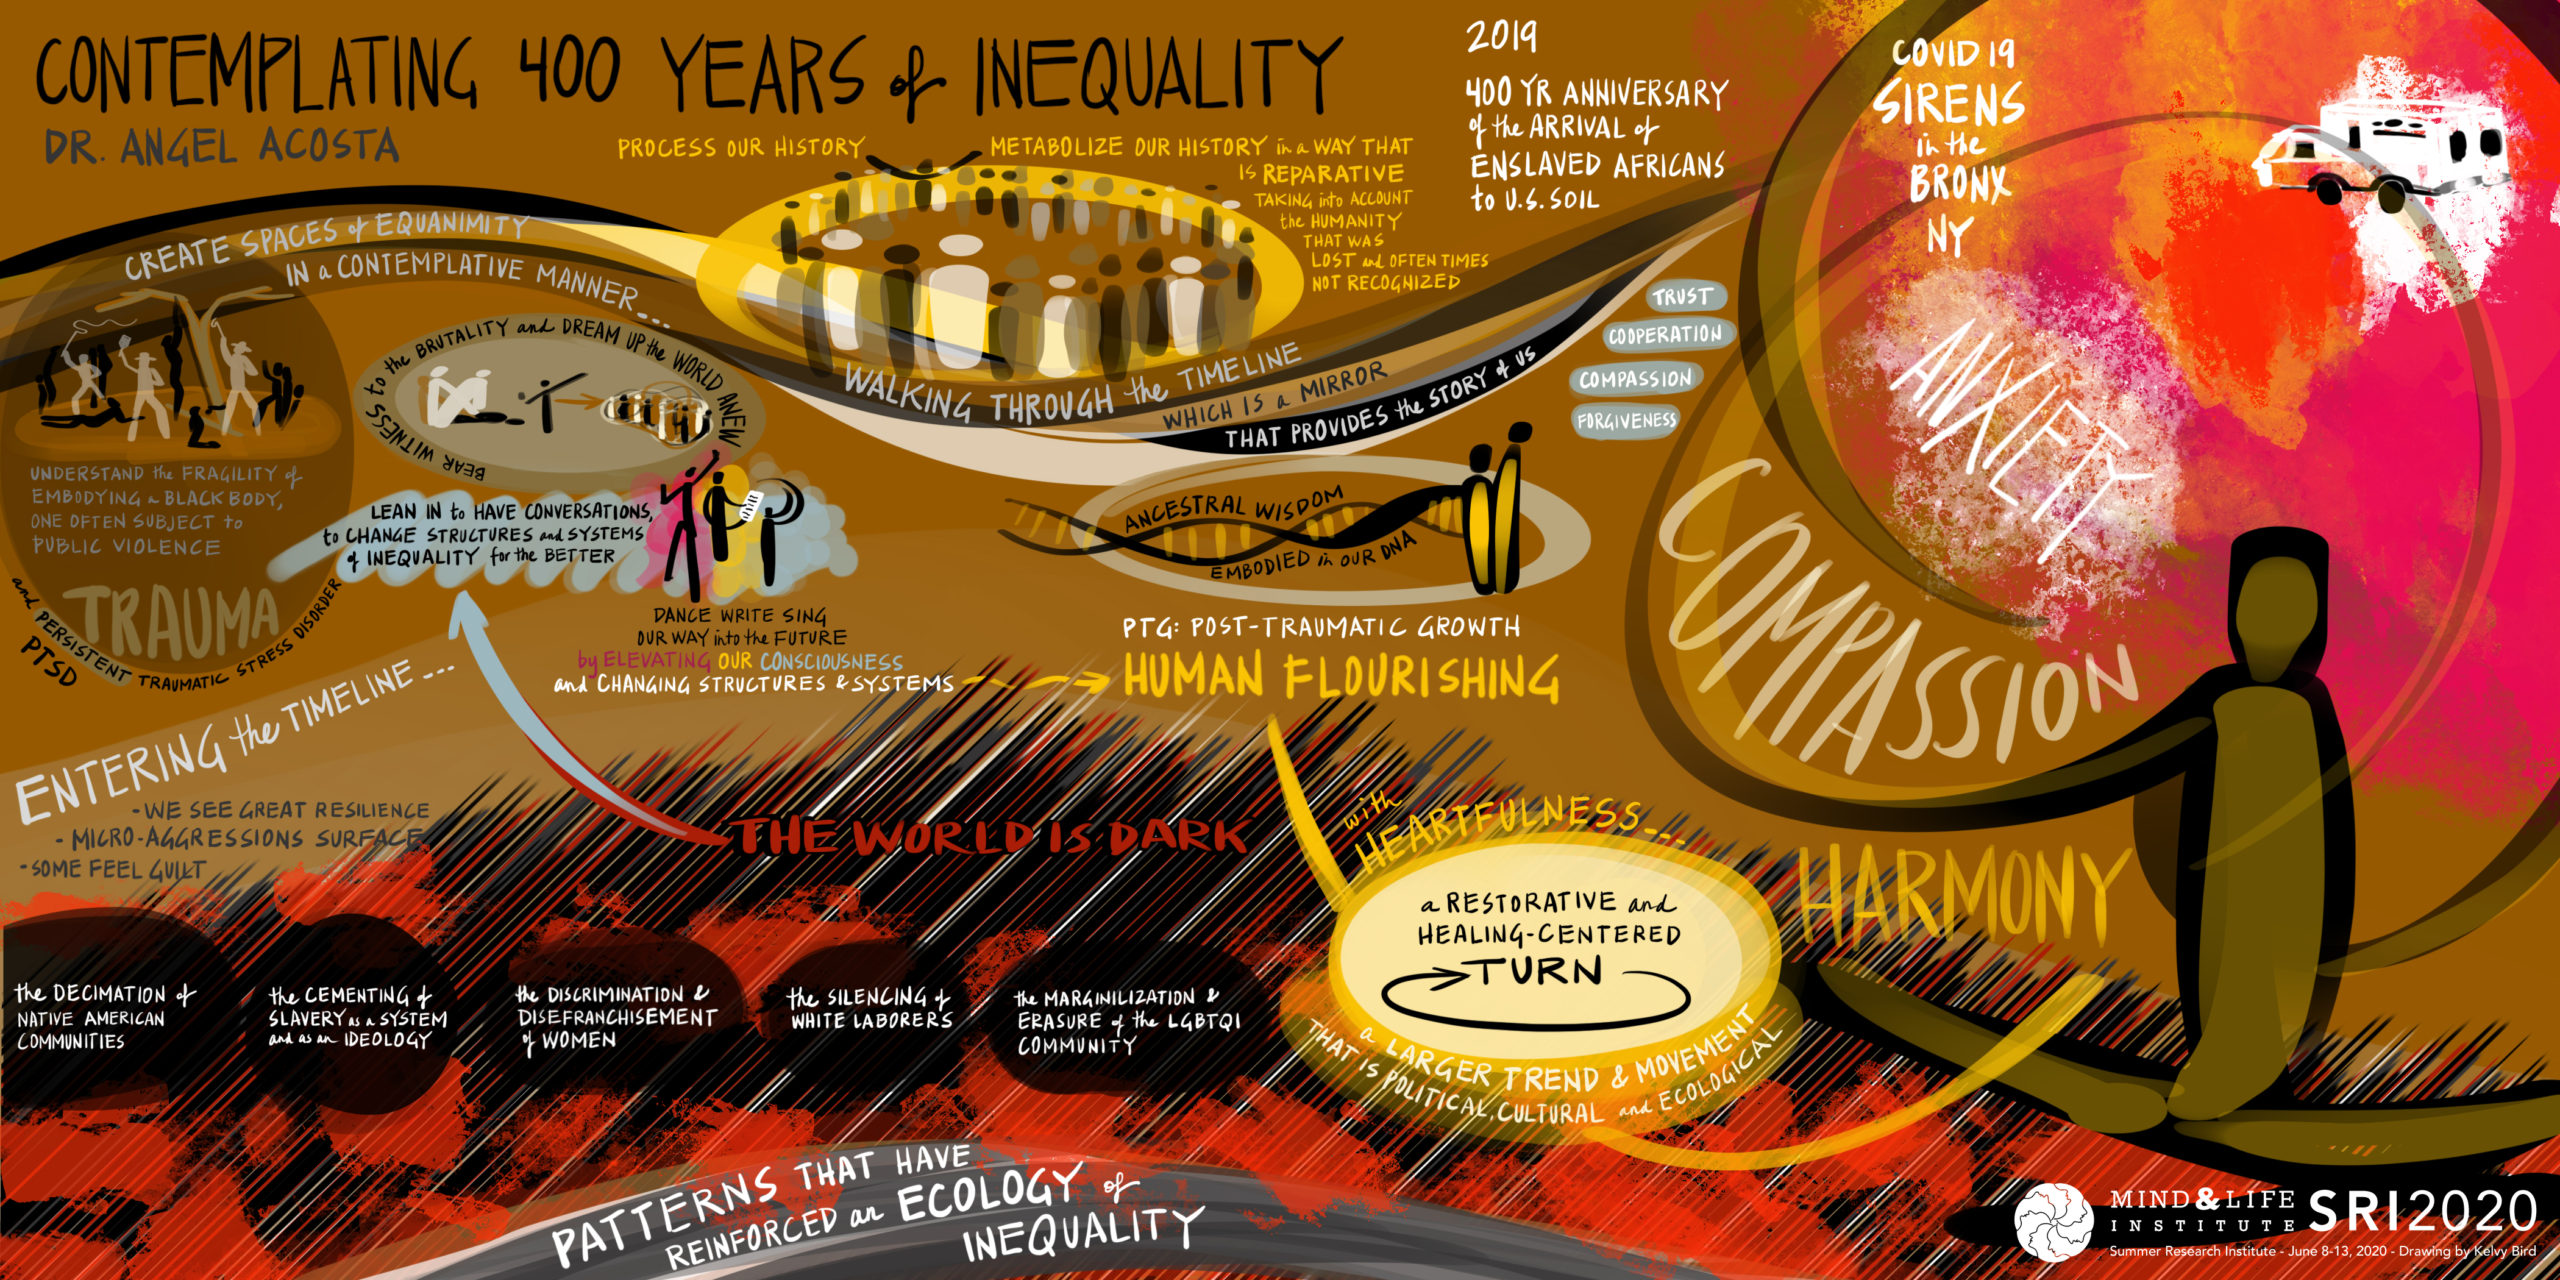
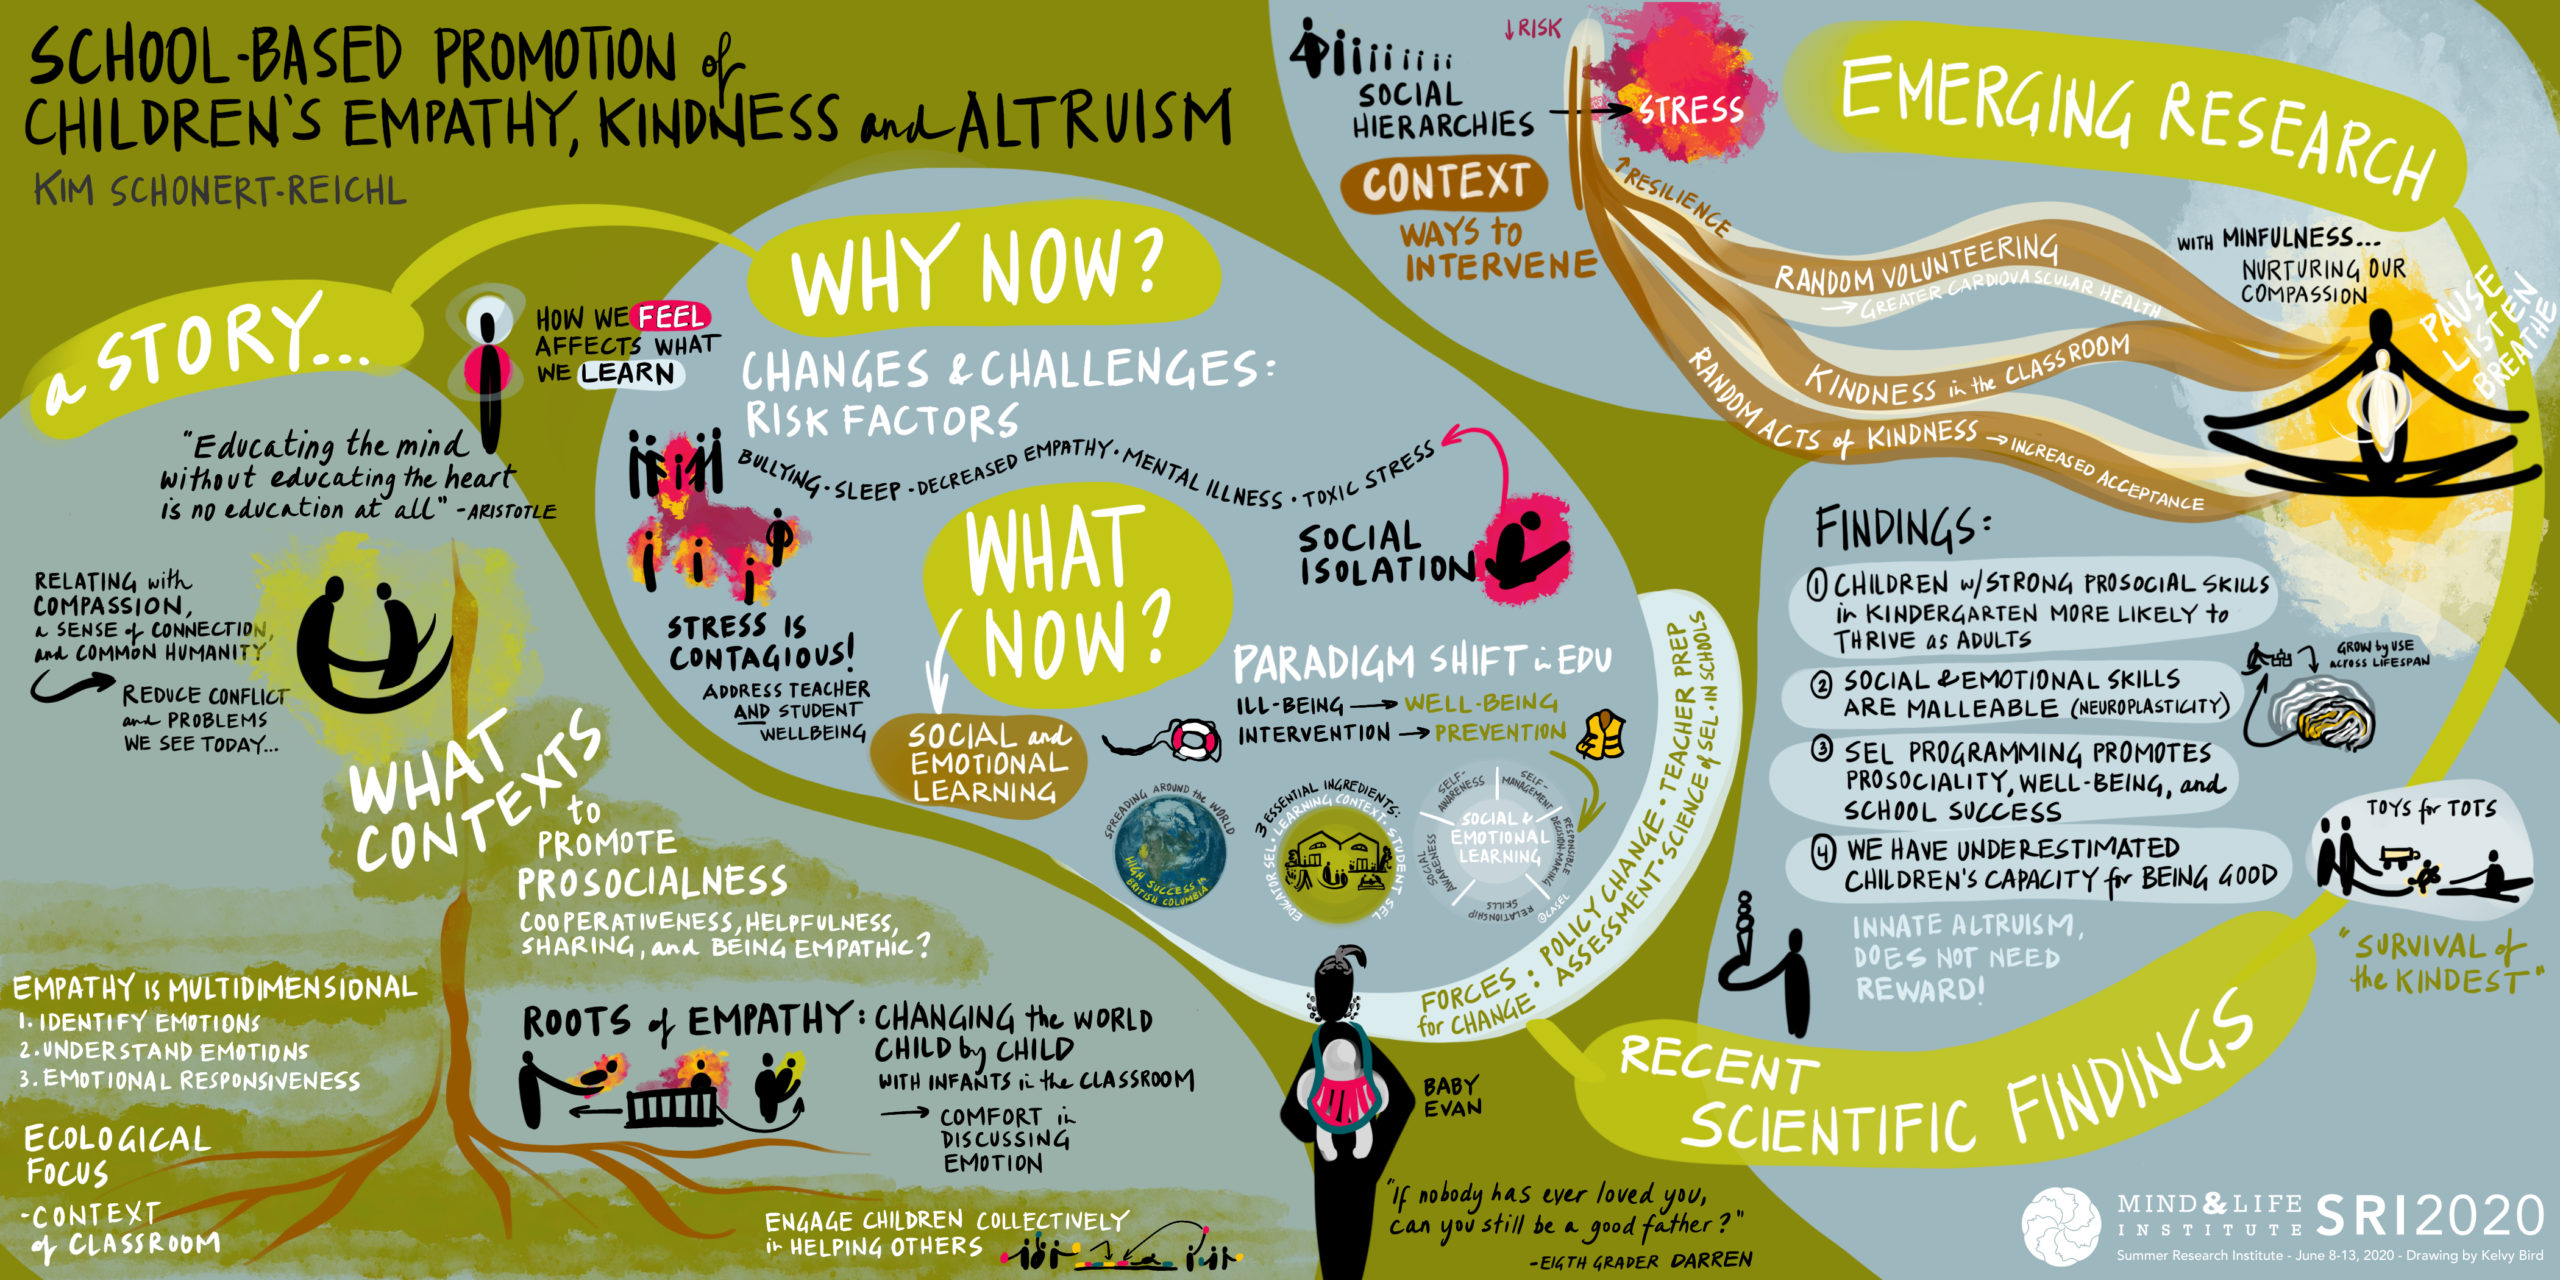
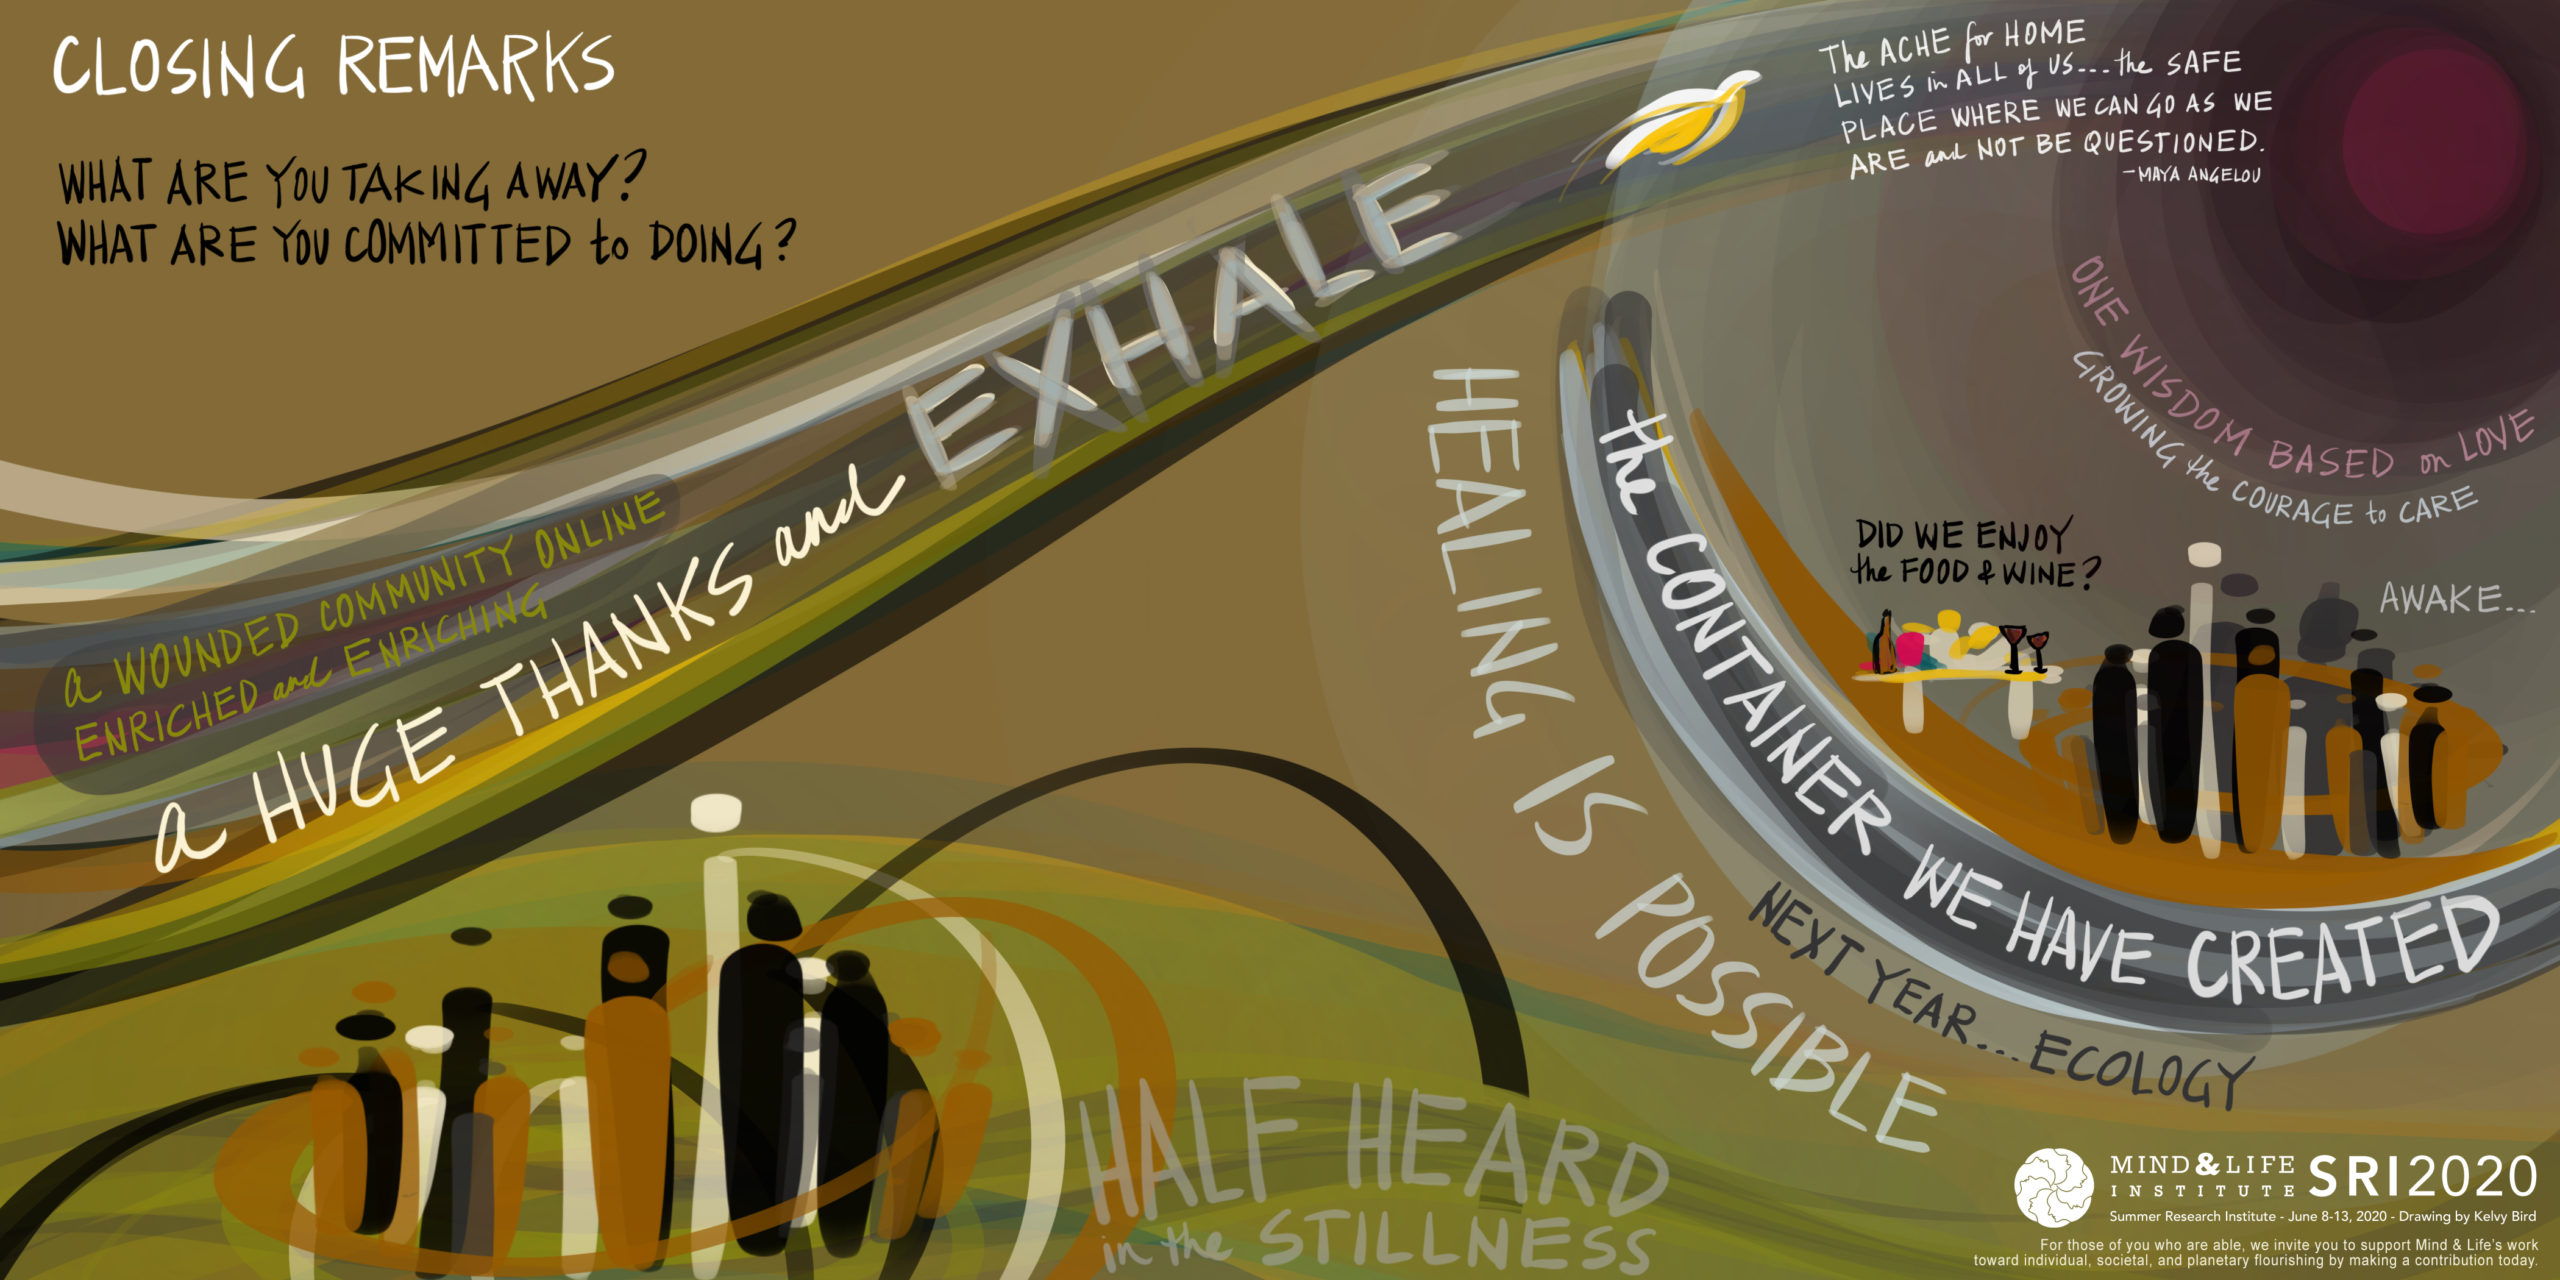
Developmental Contemplative Science: Framework for the Study of Prosocial Development, with Phil ZelazoThe Role of Contemplative Practice in Cultivating Cultural Humility and Inclusivity in Research and Education, with Kamilah MajiedTrust and Fairness in Development, with Philippe RochatCompassion-centered Spiritual Healthcare, with Jennifer MascaroOur Stories Are Our Medicine: Centering Culture and Healing through Story Work with Indigenous Communities, with Ramona BeltránNo Place Like Home: Decolonizing Our American Dreams and the Necropolitics They Bury, with Jasmine SyedullahContemplating 400 Years of Inequality: A Mindfulness & Compassion Community Practice, Angel AcostaSchool-Based Promotion of Children’s Empathy, Kindness, and Altruism: Emerging Research, Lingering Questions, and Future Directions, with Kimberly Schonert-ReichlClosing Remarks – A Summation of Takeaways
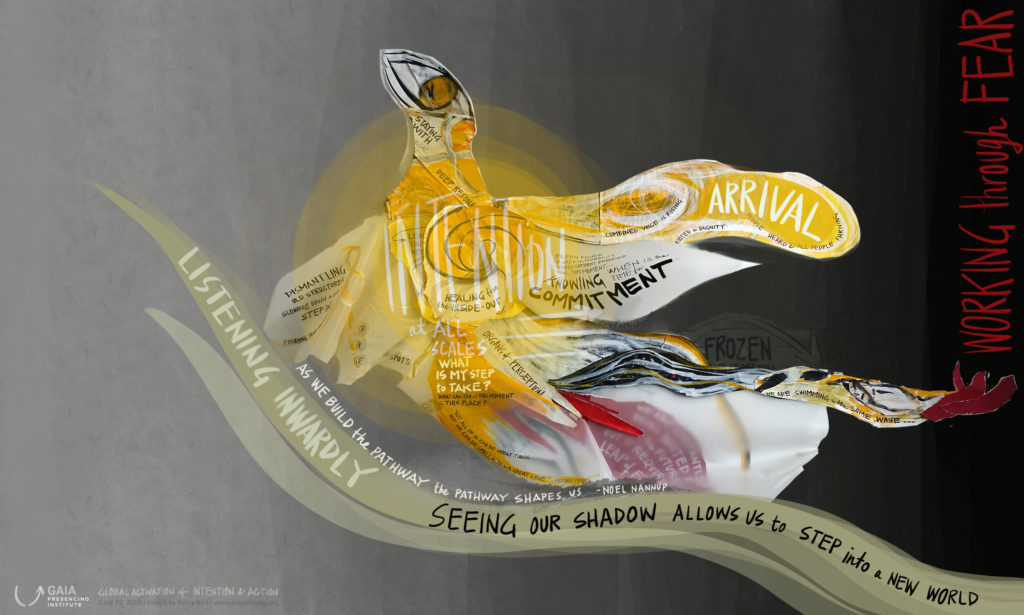
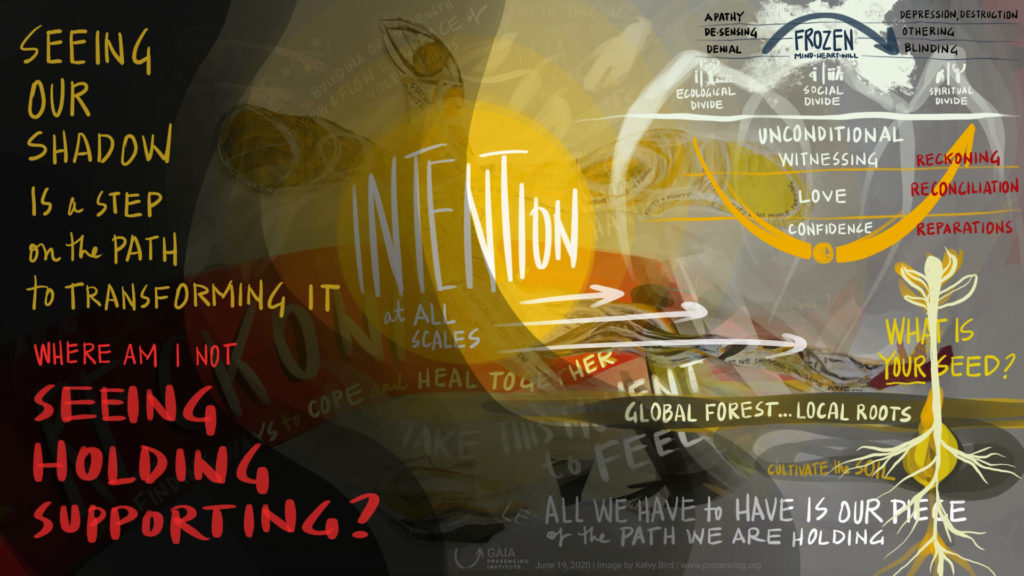
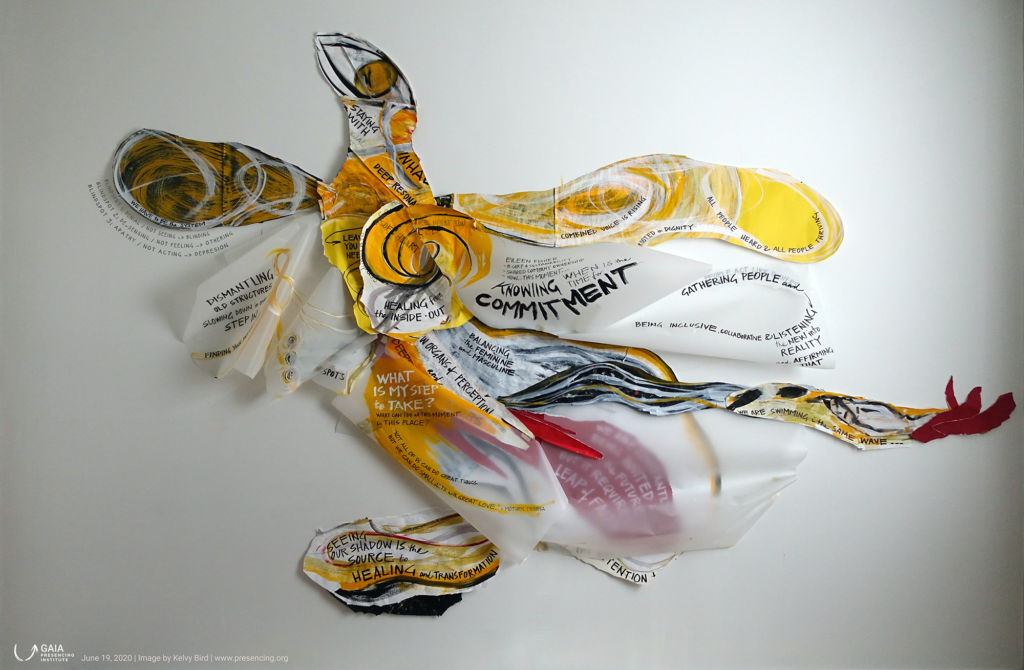
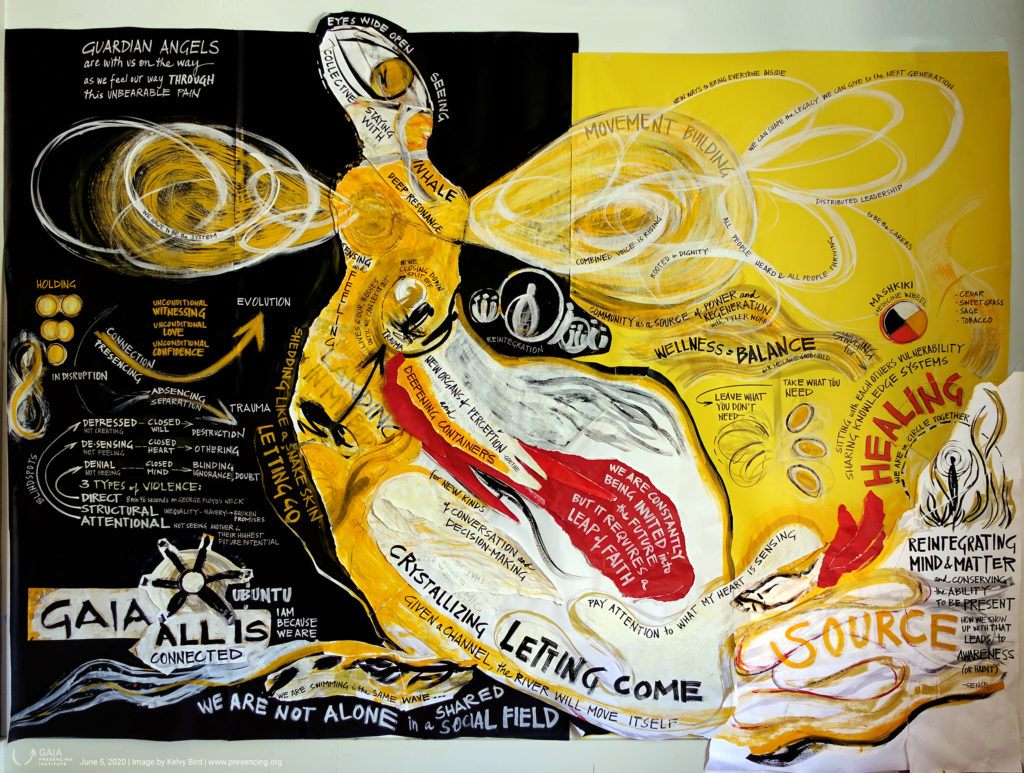
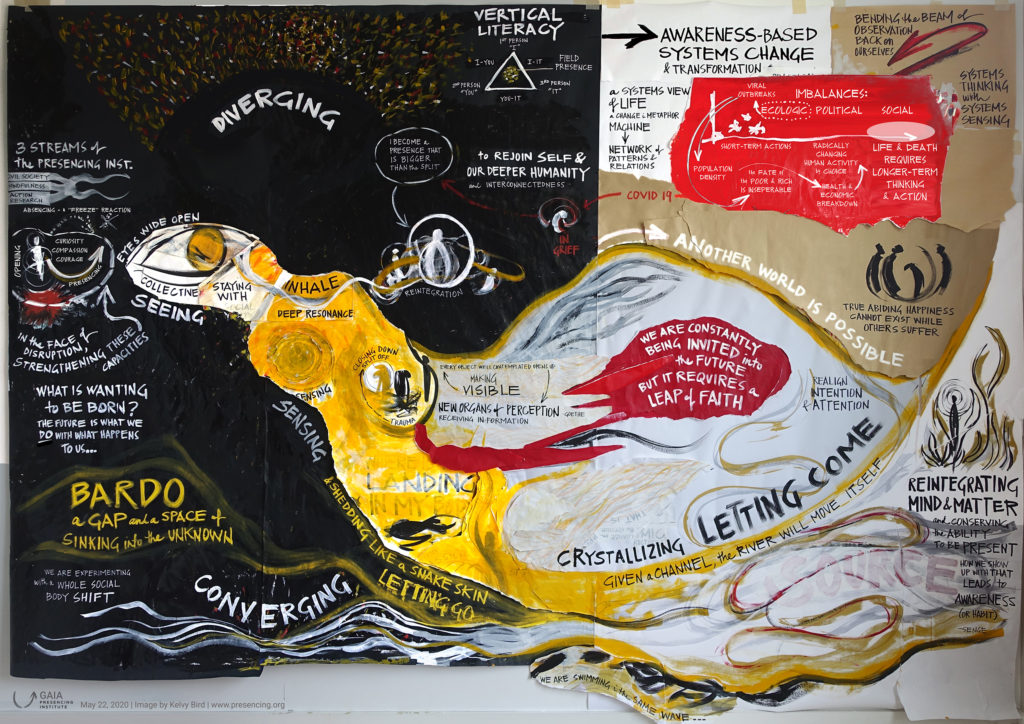
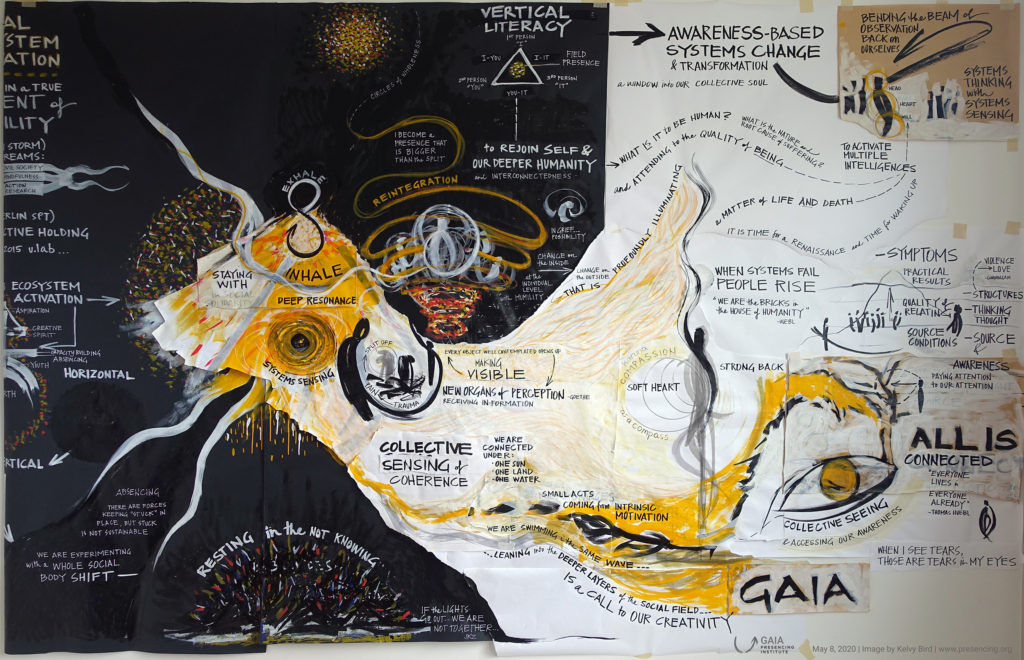
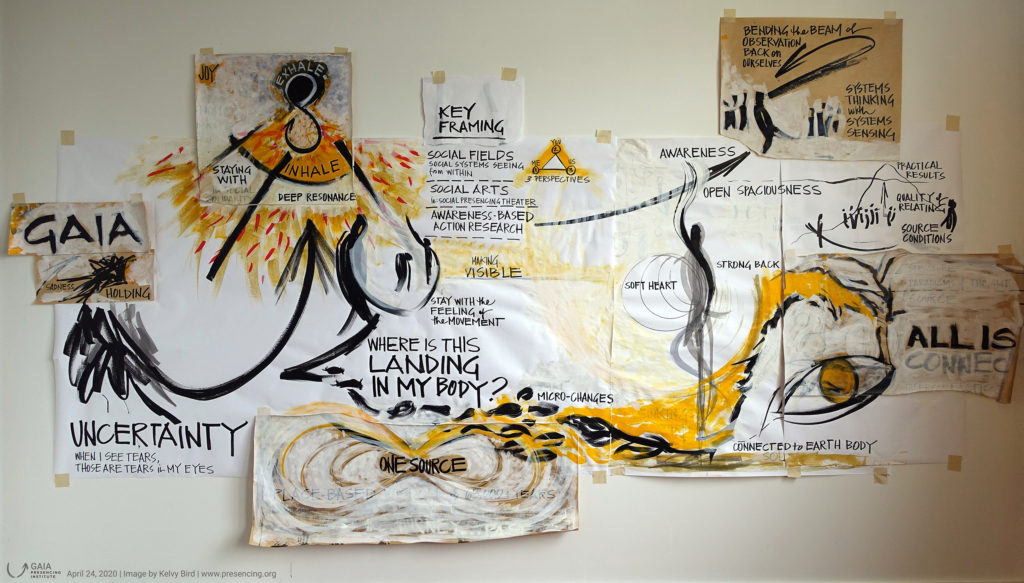
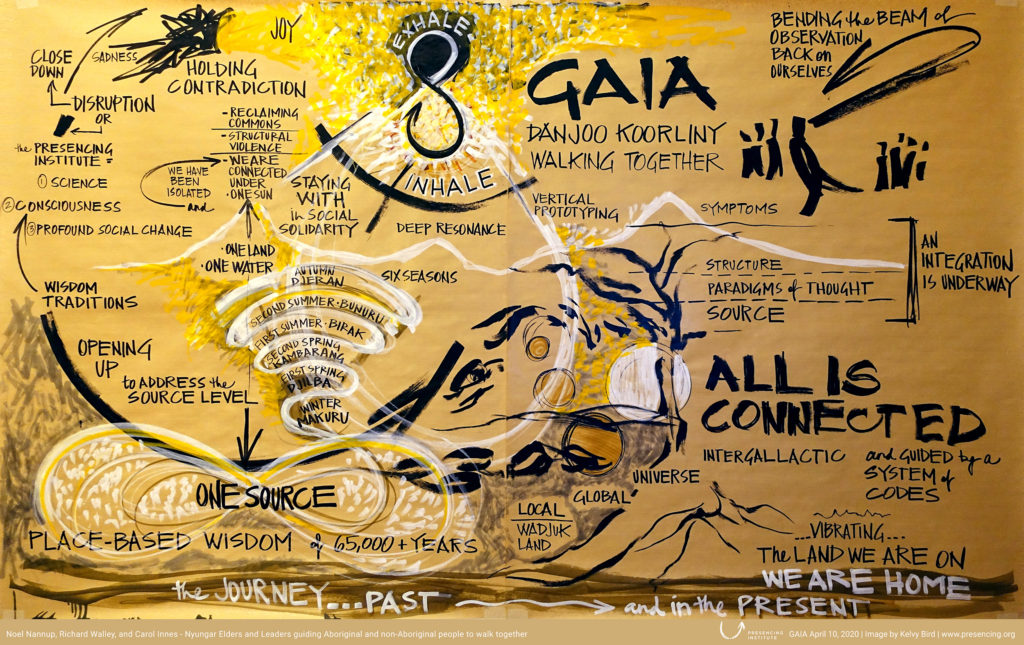
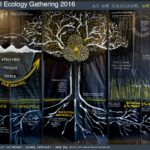
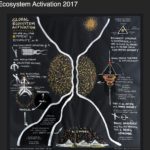
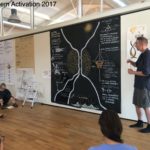
There is a story to tell, but for now, i will let the images do the talking. Each builds into the previous, conceptually for ten years, and literally now for 13 weeks through the GAIA Journey. Continual unfolding, enfolding, unfolding. See a reflective video of the final evolution here.
Images from GAIA, last to first:
iPad
iPad
ink on paper and mylar
iPad
iPad
iPad
iPad
acrylic on paper
acrylic on paper
acrylic on paper
acrylic on paper
acrylic on paper
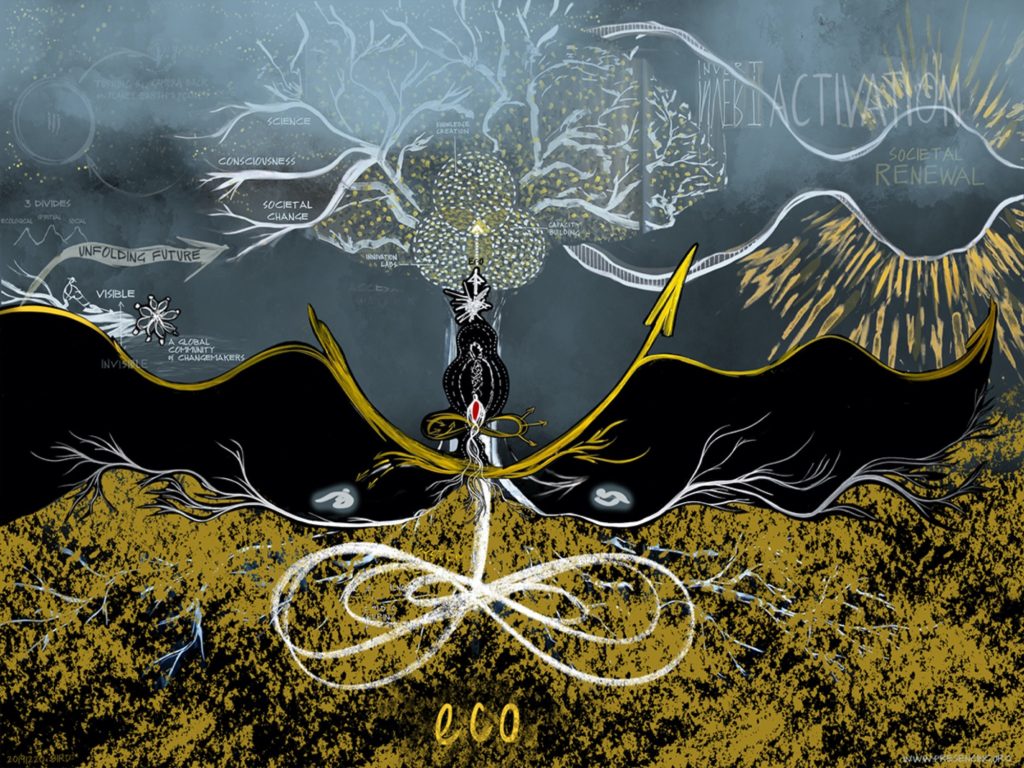
Images that informed the GAIA drawing, last to first:
This is an expansion, a reemphasis, of the original post i wrote up on “containers” back in 2015. It’s offered to complement recent thinking around Systems Scribing, which explores the intersection of scribing and systems thinking, particularly when considering “systems being”. This is when we start to consider systems not only as cognitive exercises, but as essential matters of the heart, with felt understanding of the interconnectedness of all things. This has possibly never been more needed on the planet than it is now.
To note, this thinking is based on the work of William Isaacs as well as the Circle of Seven, including: Barbara Cecil, Glennifer Gillespie, and Beth Jandernoa.
In it, i write: As visual practitioners, as artists, we aim with care and responsibility to reach people, to expand the boundaries of the assumed known. Any reach requires steadiness, and to ensure a stable core, we rely on support for our essential, creative selves.
Around the diamond, the iceberg, and presencing —supporting these states of being and diagnostic methods— are what I’ve already referred to in this book as containers: holding spaces for places, people, and states of the heart.
The weakness or strength of a container determines the likelihood for detrimental or successful conversation, for harmful or loving relations, for destructive or productive environments, for ill- or well-being.
In a way, just as ice forms from and melts back into a pond, containers provide energetic ground for life and death, for growth and decay. We serve as containers for others, and they for us. The stronger a container, the stronger the trust, the stronger the safety, the more that can be nourished, tended, grown, realized.
Here’s an example. As my grandmother Margaret Bird was aging, at a point when she could only go outside with a walker and physical assistance, we would occasionally lunch at a local diner in New York City. She would ask me things about my life, about school, about my friends, about my studies, and she would marvel at the complexity of the world in which I lived. (This was 1984, so we can only imagine what she would say about our world today!)
What I recall most poignantly is the way she paid attention, seeming to hang on every word, and the way she made me feel safe and loved—loved no matter what I said, no matter what I had to share. I never felt judged. No matter what she thought about the details of my escapades, she listened closely, looked me in the eye, and continued to pursue an understanding of my life.
She provided a container, a space where I could see myself more clearly and grow as direct result of how she was holding me.
In my work as a scribe, I try to reinforce the container for the group. When a group heats up and fractures, the container needs to strengthen, to better support what wants to come to light. I don’t do this by adding a specific line or word to a page, but by enhancing my quality of listening and building the group’s trust in my very being. I turn around, and see the group, feel it, open my heart to the individuals, try to put myself in their seats, find human-to-human compassion, soften, expand.
Sometimes the container in the room is so strong that the scribe might be enveloped in its power. Our ability to “show up” increases because the room is holding us, in a way, as my grandmother held me so well, years ago. In this case, I notice the strength, thank the heaven and earth for the quality of the group, and draw with pure joy.
When my grandmother, somewhat hard of hearing and surely with many of her own personal concerns, was able to show up for me so completely, I was completely able to show up for her too. I could be more vulnerable because I felt safe. She brought out the purest part of me by how gracefully she held me in her own heart.
Love, as a base note, is the ore, and order, of the container.
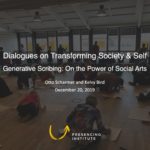
What a session! What a year. What a decade. What a partnership.
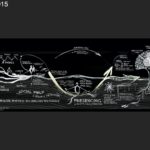
On the eve of the 2019 winter solstice (for the northern hemisphere) Otto Scharmer interviewed me regarding Generative Scribing and the Power of Social Arts. It was the last episode of the year for Dialogues on Transforming Society & Self, a series of monthly interactive online talks. “With a variety of guests, stories and breakout sessions, these dialogues provide a space for coming together and sensing into inspiring examples of societal renewal.” Find a recap of our episode here, as well as previous interviews, on the Presencing Institute website.
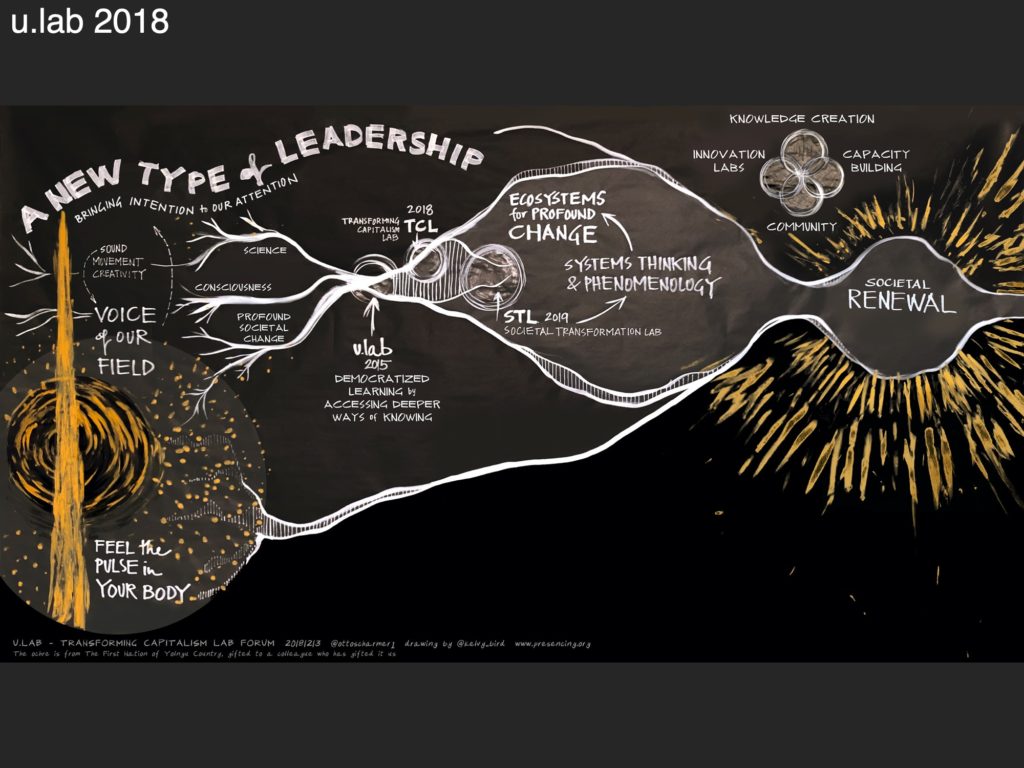
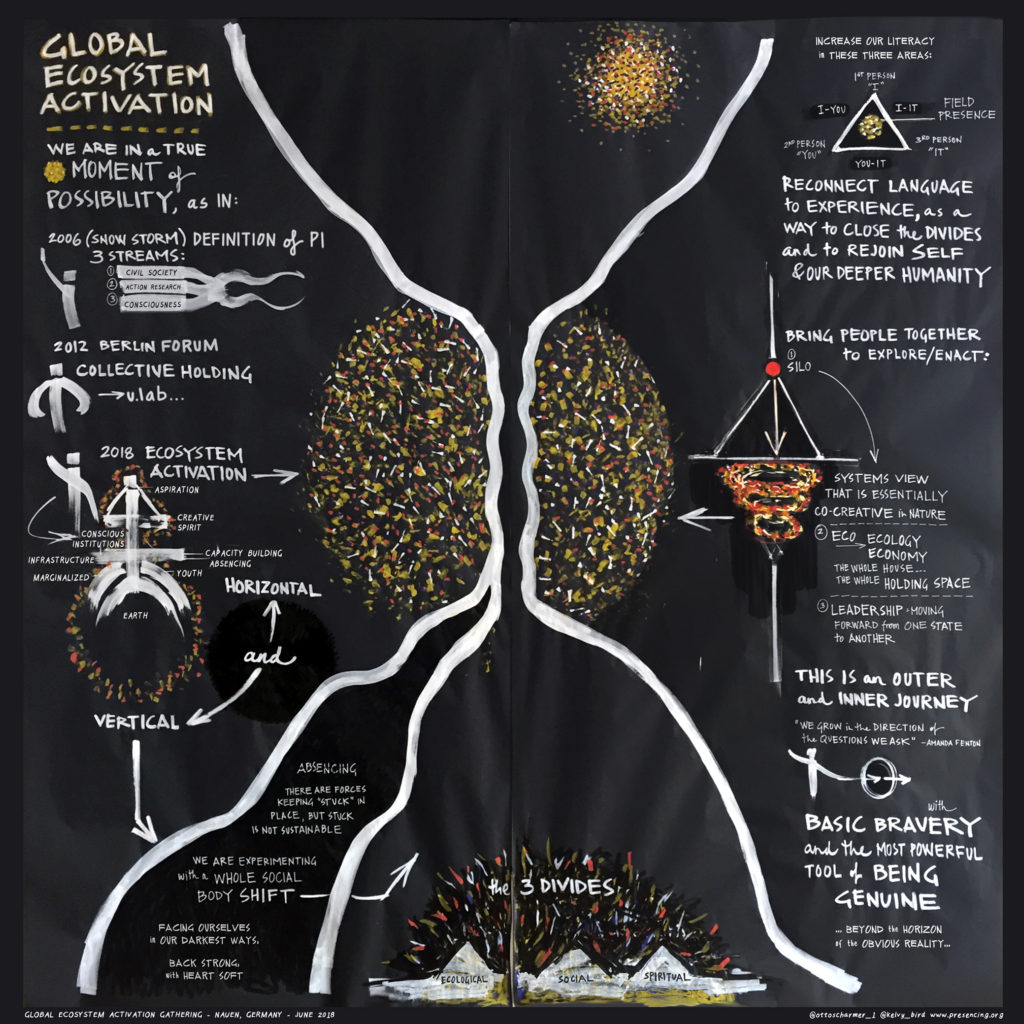
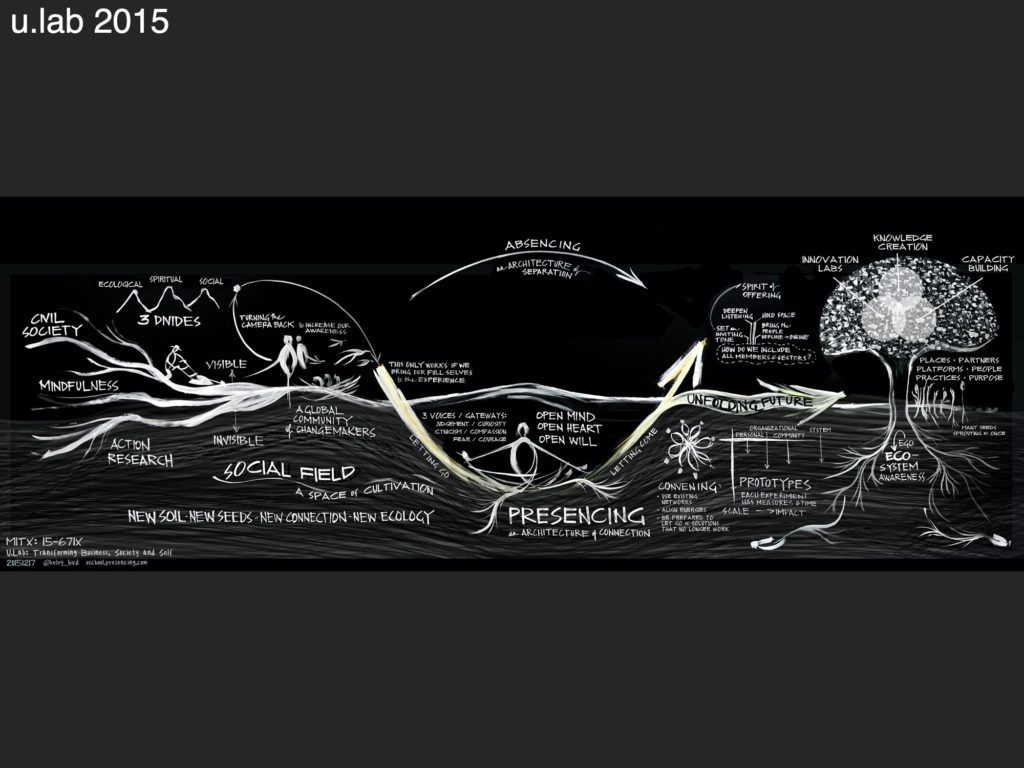
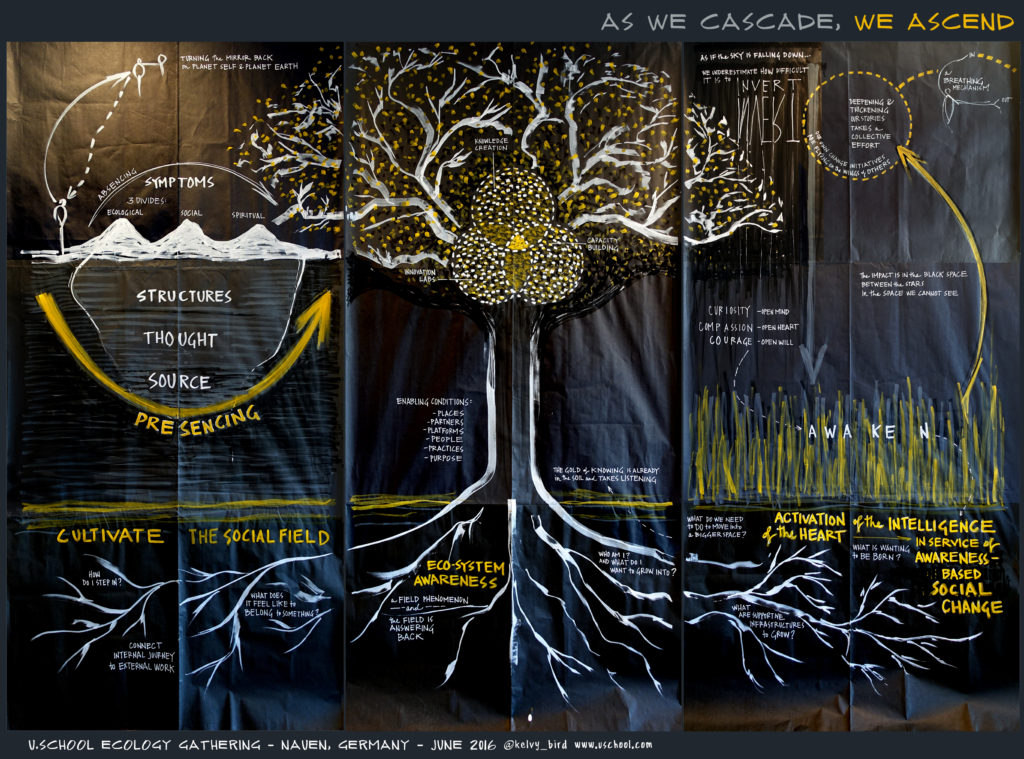
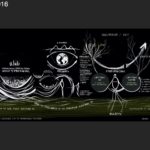
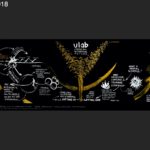
After Otto and I conversed for about 20 minutes, we guided the community through a resonance process, attending our collective awareness to a series of “footprint” images created over the last decade of our work together. Find the slides in the gallery below. The resonance process was followed by virtual break out spaces, and then some group reflections at the very end of the 75-minute session.
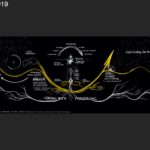
Of note was how the power in my home completely shut down for about 5 minutes through the image “pulsing”. It was as if the energy of the entire group, and the focus on the images, was high enough to cause an outage! That is probably not the real explanation. But as the team scrambled on the back end to find out what happened, and as i desperately tried to reconnect, Otto picked up the presentation and there seemed to be minimal disruption. A few slides which would have been in that gap are added below. The resonance process started with the u.lab images and ended with increased time on the final synthesized image, which we refer to as “Solstice”.
Recording of the Session
Images Shared
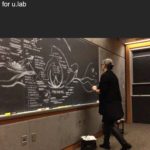
chalk on board
acrylic on paper
iPad
Chat Questions with Responses and Resources
Jerry Michalski: Kelvy, did you at one time see a graphic facilitator in action, or did you start taking visual notes spontaneously?
I started in 1995 by joining a team of MG Taylor knowledgeworkers, to support a DesignShop for NASA wind tunnels. Scribing was one facilitative role in support of “releasing group genius”. I had met Matt and Gail when they came to visit Chris Allen in San Francisco, CA. I was working for Chris, who had a company called Consensus (focused on groupware) as his office administrator. I’d also been working on a collaborative art project with architect friends from college. When Matt and Gail were visiting out west, they saw the artworks and thought I’d be a good fit in the highly-collaborative sessions they were running. You can read more here about Matt and Gail’s work here, and a graphic talk by Andrew Park (inventor of those RSA Animate videos) on their processes.
I was also very involved in theater in high school, which is another kind of social, collaborative art. Many streams probably fed into the eventual practice of scribing.
Jerry Michalski: Were you scribing before arriving at MG Taylor, or did you learn it there?
I learned it there! And it took a loooong time. Everyone thought I could start right away, but it took me about two years to get comfortable drawing in front of people. Also, I am a slow learner.
tori craig : Kelvy, how do you sort out what’s happening among the group vs. your own interpretation/mindset?
Scribing is a balancing act between intuitive and cognitive abilities. Perhaps it’s like running constant mini “U”s… where we observe, sense, presence, and then have a quick check in internally on what is “in here” and what is “out there” and discern if there is alignment between the two (which are also really the same, but split out for the purposes of drawing.) Then a very quick shift into crystallizing the content into the drawing. Good question – and i will give it more thought and come back. People ask this all the time…
Nancy White : “A gift to offer, not a gift to have.”
I really like this quote. I think it sums up the approach.
Lily Martens: Kelvy what other art forms do you see that we can use to do this? Do you experiment with that as well?
Gosh – i would say all. I write a lot, journalling, personally and also for almost every professional situation i’m in. It’s a helpful tool for reflection, also requires discipline to do (like all art forms I suppose!)
barbara: For those with no artistic skills, how could we personally use scribing? I like the visual models but could not possibly produce one.
You can use scribing in any context to help people see. The difference between scribing and other visual art forms is that it is social – the content comes from a context of a group of people, rather than representing only one person’s views (though it’s common to scribe for one presenter of content, there is still an audience that participates in the overall context of the speaking…). Therefore, I’d say try in a safe environment first, perhaps with family or friends who are trying to think something through, and experiment where you can.
April Doner: Re: People with no artistic skills… just wanted to share one resource I love from a friend in the disabilities justice movement (scribing is a massive tool for accessibility in that field)… https://inclusion.com/product/hints-for-graphic-facilitators/
See also this program page for capacity development offerings from a trusted ecosystem of practitioners. There are a number of in person and offline opportunities to learn at very beginning stages.
Jerry Michalski: good book on drawing simply: Dan Roam, Back of the Napkin
Yes! I very much admire Dam Roam and all his books. Other great resources: David Sibbet, Dave Gray, Mike Rohde, and Brandy Agerbeck. And this book is really a massive and thorough compilation: The World of Visual Facilitation. And please please please remember this practice is as much—or more—about listening and sense making than it is drawing beautiful pictures. You can draw in a very basic way and still get the essence of what is being said, and help a group see, as long as you have the inner skills that combine with the skills of the hand.
Maria Grette: I paint “from the future”. Paintings emerge from a meditative source and sometimes manifest in life up to years later. Is this related to scribing?
Yup! I can relate…
Hermann Funk: I see scribing as a valuable tool for prototyping, or am I wrong?
You are most definitely right. Especially system mapping, where you can clearly define places, stakeholders, processes of iteration over time…
Jerry Michalski: apropos other kinds of mapping, here’s ABCD in context: https://bra.in/2vmxPJ and Kelvy, in context: https://bra.in/8qa7AE
For the master of visual modeling, spend some time in Bryan Coffman’s website. He was one of my key early mentors in the field, and remains top of the charts for thinking and practicing scribing, especially in a strategic context.
Robert Wanalo: will the slides be available after this? 🙂
See above!
Nancy White: frozen Kelvy?
The computer in my home completely – yes, completely, went out! My computer went dark, internet down – all in an instant. While i scrambled to rejoin through my phone, the power came back on, but Otto had pick it all up and kept the process going, with barely a hiccup. Here is to team spirit!
Marilee Adams: If we consider an image like an answer, a visual answer, that makes me wonder from what questions/inquiries might a particular image/answer have emerged?
I love this question and need to sit with it.
Nancy White: The Ochre is a story that stays and stays with me
Emily Abramovich: Agree with April. I’m curious to know more about the physical process.
Oh wow – there is so much to share here. Scribing is quite physical. I’m not sure how to answer in a concise way. Maybe look at the program page to see the various pics and set up? I have been advocating lately that a great scribe can work on any surface in any condition: from room-surrounding white (dry erase) boards that wrap up to 40′ to a patch of sand on a beach – even to a Post-It note.
Jana, Deerfield OH WE, The World: why just these colors? why not purple or deep blue? Deb: How do you decide what colors to use? (Or is it just dependent on what you have available at the time?)
Well…… color is so critical in my mind, as it’s a subtle influencer and can say a great deal in relative silence. It’s a powerful medium. The colors i use with the Presencing Institute are distinct, as we chose the pallet at one point in time for the website, and then used more broadly in our design and communications. This translated over into my scribing for u.lab and key ecosystem gatherings. That is probably why they feel so uniform in the drawings above. There are a number of us in PI working on various products, independently, and color palette has helped with our consistency.
And, there is so much more on this. See the end of this post for some color coding info in relation to that one drawing. I will try to get permission to share a chapter I recently co-authored with Holger Nils Pohl called Using Color, in a recently published book: The World of Visual Facilitation.
barbara: I sense a groupthink that perhaps is blinding people to the actual difficulty of the current situation
I appreciate this comment. As i think you were experiencing in our process, the self-selected social field—as we had on the call—can sometimes create a series of “follows”, where there can be a snowballing effect of agreement, and a difficult condition in which to bring in an “oppose”. (See above relevant reference to William Isaac’s book on dialogue.) This happens in scribing too, where one mark can follow another, and we stop listening to the discord that ALSO has necessary information in it, as balance. It’s key to listen for the full range of inputs, regardless of proportion. It offers correction. As has your comment.
It’s easy for a scribe to get caught up in polite downloading Otto’s Conversation Field Level 1, because it’s a more comfortable place to be in, especially when immersed in the real-time pressure of live drawing. But it’s critical to be able to hold a steady container and support a social field shift into Level 2: Debate, which is where discord comes in. If you can’t handle this, and then also listen for shifts to Level 3: Dialogue, and the Level 4: Collective Creativity…. then you as a scribe, or facilitator, you will not really help balance out the stuck reinforcing feedback loop a group is experience.
I guess it boils down the overall maturity and strength of the container of the group itself…. (which would have been the 250 people on our call), and time together, to allow for field shifts that can enfold difference.
Sherrill Knezel: Another question that surfaced…what can we or are we willing to let go of in order to serve the social field?
Ego.
trishbroersma: Tips for planning visual space with a new topic or new group?
Hm. A LOT goes into planning. Perhaps read this post as a start to get the scope? I’m not sure, though, if this is what you meant by the question…
angele: are you also continuing your painting in the studio?
Well…. not really. I have a small studio that is ready and waiting. It’s one of my 2020 intents, to start up again – combined with an intent to travel less for work and stay more local.
sylvie: Maybe this is unrelated but would Kelvy want to share where her name comes from?
Ha! “Kelvy” comes from McKelvy, which was the maiden name of my grandmother, Margaret McKelvy Bird. It’s obviously then from her parents, Robert and Florence McKelvy.
Elizabeth Carney: Hoping the images can be shared? Susanne Maria Weber: Can we please have prints of those wonderful images?
You can see the images above, and click on them for a higher resolution version you can print.
Veronika: Are there any resources how to start learning gernerative scribing?